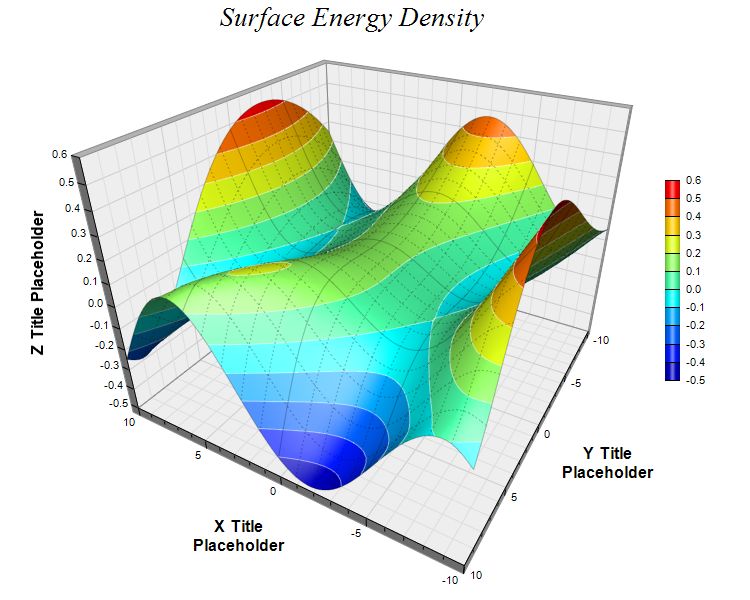
This example demonstrates using deep perspective. It also demonstrates surface grid lines of different line styles.
The following is the command line version of the code in "cppdemo/surface3". The MFC version of the code is in "mfcdemo/mfcdemo". The Qt Widgets version of the code is in "qtdemo/qtdemo". The QML/Qt Quick version of the code is in "qmldemo/qmldemo".
#include "chartdir.h"
#include <math.h>

int main(int argc, char *argv[])
{
    // The x and y coordinates of the grid
    double dataX[] = {-10, -9, -8, -7, -6, -5, -4, -3, -2, -1, 0, 1, 2, 3, 4, 5, 6, 7, 8, 9, 10};
    const int dataX_size = (int)(sizeof(dataX)/sizeof(*dataX));
    double dataY[] = {-10, -9, -8, -7, -6, -5, -4, -3, -2, -1, 0, 1, 2, 3, 4, 5, 6, 7, 8, 9, 10};
    const int dataY_size = (int)(sizeof(dataY)/sizeof(*dataY));

    // The values at the grid points. In this example, we will compute the values using the formula
    // z = Sin(x * x / 128 - y * y / 256 + 3) * Cos(x / 4 + 1 - Exp(y / 8))
    const int dataZ_size = dataX_size * dataY_size;
    double dataZ[dataZ_size];
    for(int yIndex = 0; yIndex < dataY_size; ++yIndex) {
        double y = dataY[yIndex];
        for(int xIndex = 0; xIndex < dataX_size; ++xIndex) {
            double x = dataX[xIndex];
            dataZ[yIndex * dataX_size + xIndex] = sin(x * x / 128.0 - y * y / 256.0 + 3) * cos(x /
                4.0 + 1 - exp(y / 8.0));
        }
    }

    // Create a SurfaceChart object of size 750 x 600 pixels
    SurfaceChart* c = new SurfaceChart(750, 600);

    // Add a title to the chart using 20 points Times New Roman Italic font
    c->addTitle("Surface Energy Density       ", "Times New Roman Italic", 20);

    // Set the center of the plot region at (380, 260), and set width x depth x height to 360 x 360
    // x 270 pixels
    c->setPlotRegion(380, 260, 360, 360, 270);

    // Set the elevation and rotation angles to 30 and 210 degrees
    c->setViewAngle(30, 210);

    // Set the perspective level to 60
    c->setPerspective(60);

    // Set the data to use to plot the chart
    c->setData(DoubleArray(dataX, dataX_size), DoubleArray(dataY, dataY_size), DoubleArray(dataZ,
        dataZ_size));

    // Spline interpolate data to a 80 x 80 grid for a smooth surface
    c->setInterpolation(80, 80);

    // Use semi-transparent black (c0000000) for x and y major surface grid lines. Use dotted style
    // for x and y minor surface grid lines.
    int majorGridColor = 0xc0000000;
    int minorGridColor = c->dashLineColor(majorGridColor, Chart::DotLine);
    c->setSurfaceAxisGrid(majorGridColor, majorGridColor, minorGridColor, minorGridColor);

    // Set contour lines to semi-transparent white (80ffffff)
    c->setContourColor(0x80ffffff);

    // Add a color axis (the legend) in which the left center is anchored at (665, 280). Set the
    // length to 200 pixels and the labels on the right side.
    c->setColorAxis(665, 280, Chart::Left, 200, Chart::Right);

    // Set the x, y and z axis titles using 12 points Arial Bold font
    c->xAxis()->setTitle("X Title\nPlaceholder", "Arial Bold", 12);
    c->yAxis()->setTitle("Y Title\nPlaceholder", "Arial Bold", 12);
    c->zAxis()->setTitle("Z Title Placeholder", "Arial Bold", 12);

    // Output the chart
    c->makeChart("surface3.jpg");

    //free up resources
    delete c;

    return 0;
}
© 2023 Advanced Software Engineering Limited. All rights reserved.