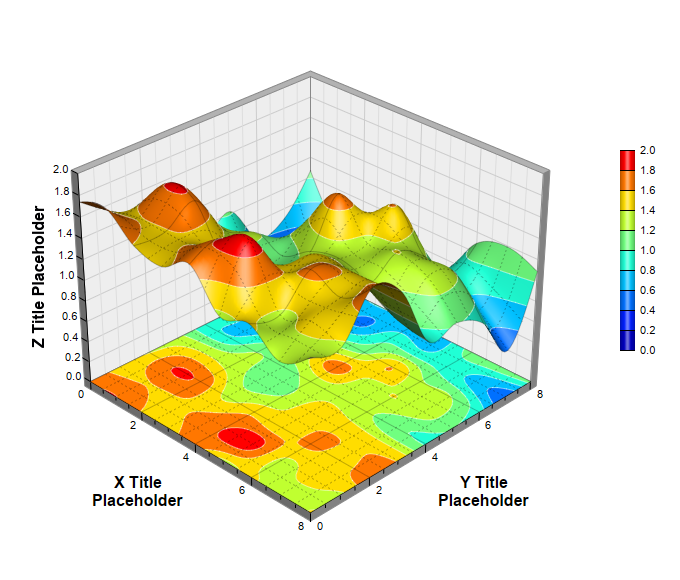
This example demonstrates adding a surface projection to the XY wall using SurfaceChart.addXYProjection.
ChartDirector 7.1 (C++ Edition)
Surface Projection
Source Code Listing
#include "chartdir.h"

int main(int argc, char *argv[])
{
    // The x and y coordinates of the grid
    double dataX[] = {0, 1, 2, 3, 4, 5, 6, 7, 8};
    const int dataX_size = (int)(sizeof(dataX)/sizeof(*dataX));
    double dataY[] = {0, 1, 2, 3, 4, 5, 6, 7, 8};
    const int dataY_size = (int)(sizeof(dataY)/sizeof(*dataY));

    // Use random numbers for the z values on the XY grid
    RanSeries* r = new RanSeries(11);
    DoubleArray dataZ = r->get2DSeries(dataX_size, dataY_size, 0.1, 1.9);

    // Create a SurfaceChart object of size 680 x 580 pixels
    SurfaceChart* c = new SurfaceChart(680, 580);

    // Set the center of the plot region at (310, 280), and set width x depth x height to 320 x 320
    // x 240 pixels
    c->setPlotRegion(310, 280, 320, 320, 240);

    // Set the elevation and rotation angles to 30 and 45 degrees
    c->setViewAngle(30, 45);

    // Set the data to use to plot the chart
    c->setData(DoubleArray(dataX, dataX_size), DoubleArray(dataY, dataY_size), dataZ);

    // Spline interpolate data to a 80 x 80 grid for a smooth surface
    c->setInterpolation(80, 80);

    // Use semi-transparent black (c0000000) for x and y major surface grid lines. Use dotted style
    // for x and y minor surface grid lines.
    int majorGridColor = 0xc0000000;
    int minorGridColor = c->dashLineColor(majorGridColor, Chart::DotLine);
    c->setSurfaceAxisGrid(majorGridColor, majorGridColor, minorGridColor, minorGridColor);

    // Add XY projection
    c->addXYProjection();

    // Set contour lines to semi-transparent white (0x7fffffff)
    c->setContourColor(0x7fffffff);

    // Add a color axis (the legend) in which the left center is anchored at (620, 250). Set the
    // length to 200 pixels and the labels on the right side.
    c->setColorAxis(620, 250, Chart::Left, 200, Chart::Right);

    // Set the x, y and z axis titles using 12 pt Arial Bold font
    c->xAxis()->setTitle("X Title<*br*>Placeholder", "Arial Bold", 12);
    c->yAxis()->setTitle("Y Title<*br*>Placeholder", "Arial Bold", 12);
    c->zAxis()->setTitle("Z Title Placeholder", "Arial Bold", 12);

    // Output the chart
    c->makeChart("surfaceprojection.png");

    //free up resources
    delete r;
    delete c;

    return 0;
}