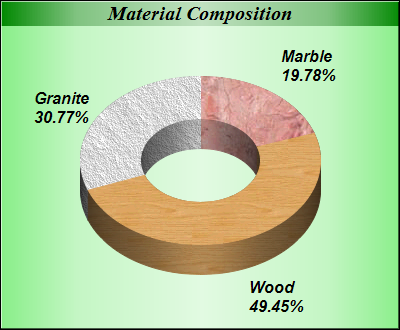
This example demonstrates wooden, rocky and marble texture effects by using pattern colors to load image patterns.
In ChartDirector, metallic and pattern colors are just like normal ARGB colors, and are represented as a 32-bit integer. They can be applied to anything that can be colored. In this example, metallic colors are applied to the background, while pattern colors are applied to the donut slices to create texture effects.
- BaseChart.patternColor2 is used to load the texture images. It returns an array of integers representing the pattern colors created from the images.
- The pattern colors are then set into the DataColor positions of the default palette using BaseChart.setColor. These colors will be used for the sectors.
The following is the command line version of the code in "cppdemo/texturedonut". The MFC version of the code is in "mfcdemo/mfcdemo". The Qt Widgets version of the code is in "qtdemo/qtdemo". The QML/Qt Quick version of the code is in "qmldemo/qmldemo".
#include "chartdir.h"

int main(int argc, char *argv[])
{
    // The data for the pie chart
    double data[] = {18, 45, 28};
    const int data_size = (int)(sizeof(data)/sizeof(*data));

    // The labels for the pie chart
    const char* labels[] = {"Marble", "Wood", "Granite"};
    const int labels_size = (int)(sizeof(labels)/sizeof(*labels));

    // The icons for the sectors
    const char* texture[] = {"marble3.png", "wood.png", "rock.png"};
    const int texture_size = (int)(sizeof(texture)/sizeof(*texture));

    // Create a PieChart object of size 400 x 330 pixels, with a metallic green (88EE88) background,
    // black border and 1 pixel 3D border effect
    PieChart* c = new PieChart(400, 330, Chart::metalColor(0x88ee88), 0x000000, 1);

    // Set donut center at (200, 160), and outer/inner radii as 120/60 pixels
    c->setDonutSize(200, 160, 120, 60);

    // Add a title box using 15pt Times Bold Italic font and metallic deep green (008000) background
    // color
    c->addTitle("Material Composition", "Times New Roman Bold Italic", 15)->setBackground(
        Chart::metalColor(0x008000));

    // Set the pie data and the pie labels
    c->setData(DoubleArray(data, data_size), StringArray(labels, labels_size));

    // Set the colors of the sectors to the 3 texture patterns
    c->setColor(Chart::DataColor + 0, c->patternColor(texture[0]));
    c->setColor(Chart::DataColor + 1, c->patternColor(texture[1]));
    c->setColor(Chart::DataColor + 2, c->patternColor(texture[2]));

    // Draw the pie in 3D with a 3D depth of 30 pixels
    c->set3D(30);

    // Use 12pt Arial Bold Italic as the sector label font
    c->setLabelStyle("Arial Bold Italic", 12);

    // Output the chart
    c->makeChart("texturedonut.png");

    //free up resources
    delete c;

    return 0;
}
© 2023 Advanced Software Engineering Limited. All rights reserved.