[MFC version] mfcdemo/ThreeDChartRotationDlg.cpp
// ThreeDChartRotationDlg.cpp : implementation file
//
#include "stdafx.h"
#include "resource.h"
#include "ThreeDChartRotationDlg.h"
#include <math.h>
#ifdef _DEBUG
#define new DEBUG_NEW
#endif
//
// Constructor
//
CThreeDChartRotationDlg::CThreeDChartRotationDlg(CWnd* pParent /*=NULL*/)
: CDialog(IDD_THREEDCHARTROTATION, pParent)
{
// 3D view angles
m_elevationAngle = 30;
m_rotationAngle = 45;
// Keep track of mouse drag
m_isDragging = false;
m_lastMouseX = -1;
m_lastMouseY = -1;
}
//
// Destructor
//
CThreeDChartRotationDlg::~CThreeDChartRotationDlg()
{
delete m_ChartViewer.getChart();
}
void CThreeDChartRotationDlg::DoDataExchange(CDataExchange* pDX)
{
CDialog::DoDataExchange(pDX);
DDX_Control(pDX, IDC_ChartViewer, m_ChartViewer);
DDX_Control(pDX, IDC_CHECK1, m_DrawFrameOnRotate);
}
BEGIN_MESSAGE_MAP(CThreeDChartRotationDlg, CDialog)
ON_CONTROL(CVN_ViewPortChanged, IDC_ChartViewer, OnViewPortChanged)
ON_CONTROL(CVN_MouseMoveChart, IDC_ChartViewer, OnMouseMoveChart)
ON_CONTROL(BN_CLICKED, IDC_ChartViewer, OnMouseUpChart)
END_MESSAGE_MAP()
//
// Initialization
//
BOOL CThreeDChartRotationDlg::OnInitDialog()
{
CDialog::OnInitDialog();
// To handle mouse drags, it is necessary to enable mouse capture. By default, MFC does not
// enable mouse capture. In ChartDirector, we can use MouseUsageDefaultCapture to enable it.
m_ChartViewer.setMouseUsage(Chart::MouseUsageDefaultCapture);
// Update the viewport to display the chart
m_ChartViewer.updateViewPort(true, false);
// In this example, the default is to draw wire frame on rotate
m_DrawFrameOnRotate.SetCheck(1);
return TRUE;
}
//
// View port changed event
//
void CThreeDChartRotationDlg::OnViewPortChanged()
{
// Update the chart if necessary
if (m_ChartViewer.needUpdateChart())
drawChart(&m_ChartViewer);
}
//
// Draw the chart and display it in the given viewer
//
void CThreeDChartRotationDlg::drawChart(CChartViewer *viewer)
{
// The x and y coordinates of the grid
double dataX[] = { -10, -9, -8, -7, -6, -5, -4, -3, -2, -1, 0, 1, 2, 3, 4, 5, 6, 7, 8, 9, 10 };
const int dataXLength = (int)(sizeof(dataX) / sizeof(*dataX));
double dataY[] = { -10, -9, -8, -7, -6, -5, -4, -3, -2, -1, 0, 1, 2, 3, 4, 5, 6, 7, 8, 9, 10 };
const int dataYLength = (int)(sizeof(dataY) / sizeof(*dataY));
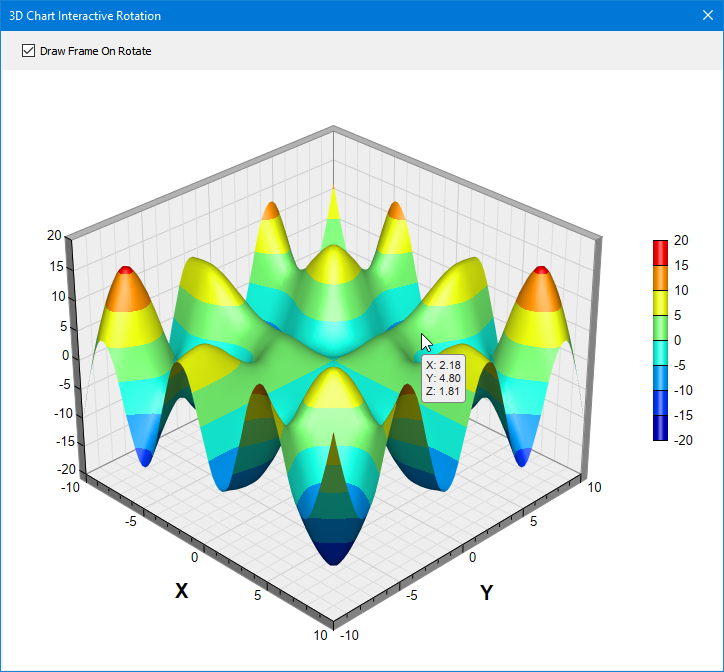
// The values at the grid points. In this example, we will compute the values using the
// formula z = x * sin(y) + y * sin(x).
double dataZ[dataXLength * dataYLength];
for (int yIndex = 0; yIndex < dataYLength; ++yIndex)
{
double y = dataY[yIndex];
for (int xIndex = 0; xIndex < dataXLength; ++xIndex)
{
double x = dataX[xIndex];
dataZ[yIndex * dataXLength + xIndex] = x * sin(y) + y * sin(x);
}
}
// Create a SurfaceChart object of size 720 x 600 pixels
SurfaceChart *c = new SurfaceChart(720, 600);
// Set the center of the plot region at (330, 290), and set width x depth x height to
// 360 x 360 x 270 pixels
c->setPlotRegion(330, 290, 360, 360, 270);
// Set the data to use to plot the chart
c->setData(DoubleArray(dataX, dataXLength), DoubleArray(dataY, dataYLength),
DoubleArray(dataZ, dataXLength * dataYLength));
// Spline interpolate data to a 80 x 80 grid for a smooth surface
c->setInterpolation(80, 80);
// Set the view angles
c->setViewAngle(m_elevationAngle, m_rotationAngle);
// Check if draw frame only during rotation
if (m_isDragging && m_DrawFrameOnRotate.GetCheck())
c->setShadingMode(Chart::RectangularFrame);
// Add a color axis (the legend) in which the left center is anchored at (660, 270). Set
// the length to 200 pixels and the labels on the right side.
c->setColorAxis(650, 270, Chart::Left, 200, Chart::Right);
// Set the x, y and z axis titles using 10 points Arial Bold font
c->xAxis()->setTitle("X", "Arial Bold", 15);
c->yAxis()->setTitle("Y", "Arial Bold", 15);
// Set axis label font
c->xAxis()->setLabelStyle("Arial", 10);
c->yAxis()->setLabelStyle("Arial", 10);
c->zAxis()->setLabelStyle("Arial", 10);
c->colorAxis()->setLabelStyle("Arial", 10);
// Output the chart
delete viewer->getChart();
viewer->setChart(c);
//include tool tip for the chart
viewer->setImageMap(c->getHTMLImageMap("", "",
"title='<*cdml*>X: {x|2}<*br*>Y: {y|2}<*br*>Z: {z|2}'"));
}
//
// Rotate surface chart when mouse is moving over plotarea
//
void CThreeDChartRotationDlg::OnMouseMoveChart()
{
int mouseX = m_ChartViewer.getChartMouseX();
int mouseY = m_ChartViewer.getChartMouseY();
// Drag occurs if mouse button is down and the mouse is captured by the m_ChartViewer
if (((GetKeyState(VK_LBUTTON) & 0x100) != 0) && (GetCapture() == &m_ChartViewer))
{
if (m_isDragging)
{
// The chart is configured to rotate by 90 degrees when the mouse moves from
// left to right, which is the plot region width (360 pixels). Similarly, the
// elevation changes by 90 degrees when the mouse moves from top to buttom,
// which is the plot region height (270 pixels).
m_rotationAngle += (m_lastMouseX - mouseX) * 90.0 / 360;
m_elevationAngle += (mouseY - m_lastMouseY) * 90.0 / 270;
m_ChartViewer.updateViewPort(true, false);
}
// Keep track of the last mouse position
m_lastMouseX = mouseX;
m_lastMouseY = mouseY;
m_isDragging = true;
}
}
//
// Stops dragging on mouse up
//
void CThreeDChartRotationDlg::OnMouseUpChart()
{
m_isDragging = false;
m_ChartViewer.updateViewPort(true, false);
}
[Qt Widgets version] qtdemo/threedchartrotation.cpp
#include <math.h>
#include <QLabel>
#include <QCheckBox>
#include <QMouseEvent>
#include "threedchartrotation.h"
#include "chartdir.h"


ThreeDChartRotation::ThreeDChartRotation(QWidget *parent) :
    QDialog(parent)
{
    //
    // Set up the GUI
    //

    setFixedSize(720, 628);
    setWindowTitle("3D Chart Interactive Rotation");

    QFrame *frame = new QFrame(this);
    frame->setGeometry(0, 0, 720, 28);
    frame->setStyleSheet("background-color:#cccccc");

    m_DrawFrameOnRotate = new QCheckBox("Draw Frame On Rotate", frame);
    m_DrawFrameOnRotate->setGeometry(12, 4, 300, 20);
    m_DrawFrameOnRotate->setStyleSheet("font-size:12px Arial;");
    m_DrawFrameOnRotate->setChecked(true);

    // Chart Viewer
    m_ChartViewer = new QChartViewer(this);
    m_ChartViewer->setGeometry(0, 28, 720, 600);
    connect(m_ChartViewer, SIGNAL(viewPortChanged()),SLOT(onViewPortChanged()));
    connect(m_ChartViewer, SIGNAL(mouseMove(QMouseEvent *)), SLOT(onMouseMoveChart(QMouseEvent *)));
    connect(m_ChartViewer, SIGNAL(clicked(QMouseEvent *)), SLOT(onMouseUpChart(QMouseEvent *)));

    // 3D view angles
    m_elevationAngle = 30;
    m_rotationAngle = 45;

    // Keep track of mouse drag
    m_isDragging = false;
    m_lastMouseX = -1;
    m_lastMouseY = -1;

    // Update the viewport to display the chart
    m_ChartViewer->updateViewPort(true, false);
}

ThreeDChartRotation::~ThreeDChartRotation()
{
    delete m_ChartViewer->getChart();
}

//
// View port changed event
//
void ThreeDChartRotation::onViewPortChanged()
{
    // Update the chart if necessary
    if (m_ChartViewer->needUpdateChart())
        drawChart(m_ChartViewer);
}

//
// Draw chart
//
void ThreeDChartRotation::drawChart(QChartViewer *viewer)
{
    // The x and y coordinates of the grid
    double dataX[] = { -10, -9, -8, -7, -6, -5, -4, -3, -2, -1, 0, 1, 2, 3, 4, 5, 6, 7, 8, 9, 10 };
    const int dataXLength = (int)(sizeof(dataX) / sizeof(*dataX));

    double dataY[] = { -10, -9, -8, -7, -6, -5, -4, -3, -2, -1, 0, 1, 2, 3, 4, 5, 6, 7, 8, 9, 10 };
    const int dataYLength = (int)(sizeof(dataY) / sizeof(*dataY));

    // The values at the grid points. In this example, we will compute the values using the
    // formula z = x * sin(y) + y * sin(x).
    double dataZ[dataXLength * dataYLength];
    for (int yIndex = 0; yIndex < dataYLength; ++yIndex)
    {
        double y = dataY[yIndex];
        for (int xIndex = 0; xIndex < dataXLength; ++xIndex)
        {
            double x = dataX[xIndex];
            dataZ[yIndex * dataXLength + xIndex] = x * sin(y) + y * sin(x);
        }
    }

    // Create a SurfaceChart object of size 720 x 600 pixels
    SurfaceChart *c = new SurfaceChart(720, 600);

    // Set the center of the plot region at (330, 290), and set width x depth x height to
    // 360 x 360 x 270 pixels
    c->setPlotRegion(330, 290, 360, 360, 270);

    // Set the data to use to plot the chart
    c->setData(DoubleArray(dataX, dataXLength), DoubleArray(dataY, dataYLength),
        DoubleArray(dataZ, dataXLength * dataYLength));

    // Spline interpolate data to a 80 x 80 grid for a smooth surface
    c->setInterpolation(80, 80);

    // Set the view angles
    c->setViewAngle(m_elevationAngle, m_rotationAngle);

    // Check if draw frame only during rotation
    if (m_isDragging && m_DrawFrameOnRotate->isChecked())
        c->setShadingMode(Chart::RectangularFrame);

    // Add a color axis (the legend) in which the left center is anchored at (660, 270). Set
    // the length to 200 pixels and the labels on the right side.
    c->setColorAxis(650, 270, Chart::Left, 200, Chart::Right);

    // Set the x, y and z axis titles using 10 points Arial Bold font
    c->xAxis()->setTitle("X", "Arial Bold", 15);
    c->yAxis()->setTitle("Y", "Arial Bold", 15);

    // Set axis label font
    c->xAxis()->setLabelStyle("Arial", 10);
    c->yAxis()->setLabelStyle("Arial", 10);
    c->zAxis()->setLabelStyle("Arial", 10);
    c->colorAxis()->setLabelStyle("Arial", 10);

    // Output the chart
    delete viewer->getChart();
    viewer->setChart(c);

    //include tool tip for the chart
    viewer->setImageMap(c->getHTMLImageMap("", "",
        "title='<*cdml*>X: {x|2}<*br*>Y: {y|2}<*br*>Z: {z|2}'"));
}

void ThreeDChartRotation::onMouseMoveChart(QMouseEvent *event)
{
    int mouseX = m_ChartViewer->getChartMouseX();
    int mouseY = m_ChartViewer->getChartMouseY();

    // Drag occurs if mouse is moving and mouse button is down
    if (event->buttons() & Qt::LeftButton)
    {
        if (m_isDragging)
        {
            // The chart is configured to rotate by 90 degrees when the mouse moves from
            // left to right, which is the plot region width (360 pixels). Similarly, the
            // elevation changes by 90 degrees when the mouse moves from top to buttom,
            // which is the plot region height (270 pixels).
            m_rotationAngle += (m_lastMouseX - mouseX) * 90.0 / 360;
            m_elevationAngle += (mouseY - m_lastMouseY) * 90.0 / 270;
            m_ChartViewer->updateViewPort(true, false);
        }

        // Keep track of the last mouse position
        m_lastMouseX = mouseX;
        m_lastMouseY = mouseY;
        m_isDragging = true;
    }
}

void ThreeDChartRotation::onMouseUpChart(QMouseEvent *event)
{
    if (m_isDragging && (event->button() == Qt::LeftButton))
    {
        // mouse up means not dragging
        m_isDragging = false;
        m_ChartViewer->updateViewPort(true, false);
    }
}
© 2023 Advanced Software Engineering Limited. All rights reserved.