[Qt Widgets version] qtdemo/tracklabel.cpp
#include <QApplication>
#include "tracklabel.h"
#include <sstream>
#include <algorithm>
TrackLabel::TrackLabel(QWidget *parent) :
QDialog(parent)
{
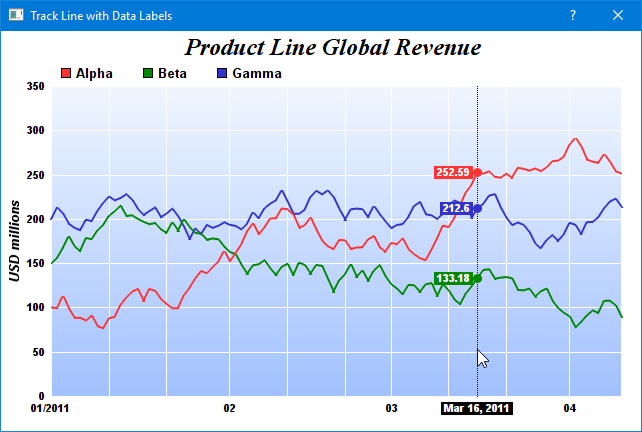
setWindowTitle("Track Line with Data Labels");
// Create the QChartViewer and draw the chart
m_ChartViewer = new QChartViewer(this);
drawChart(m_ChartViewer);
// Set the window to be of the same size as the chart
setFixedSize(m_ChartViewer->width(), m_ChartViewer->height());
// Set up the mouseMovePlotArea handler for drawing the track cursor
connect(m_ChartViewer, SIGNAL(mouseMovePlotArea(QMouseEvent*)),
SLOT(onMouseMovePlotArea(QMouseEvent*)));
}
TrackLabel::~TrackLabel()
{
delete m_ChartViewer->getChart();
}
//
// Draw the chart and display it in the given viewer
//
void TrackLabel::drawChart(QChartViewer *viewer)
{
// Data for the chart as 3 random data series
RanSeries r(127);
DoubleArray data0 = r.getSeries(100, 100, -15, 15);
DoubleArray data1 = r.getSeries(100, 150, -15, 15);
DoubleArray data2 = r.getSeries(100, 200, -15, 15);
DoubleArray timeStamps = r.getDateSeries(100, Chart::chartTime(2011, 1, 1), 86400);
// Create a XYChart object of size 640 x 400 pixels
XYChart *c = new XYChart(640, 400);
// Add a title to the chart using 18 pts Times New Roman Bold Italic font
c->addTitle(" Product Line Global Revenue", "Times New Roman Bold Italic", 18);
// Set the plotarea at (50, 55) with width 70 pixels less than chart width, and height 90 pixels
// less than chart height. Use a vertical gradient from light blue (f0f6ff) to sky blue (a0c0ff)
// as background. Set border to transparent and grid lines to white (ffffff).
c->setPlotArea(50, 55, c->getWidth() - 70, c->getHeight() - 90, c->linearGradientColor(0, 55, 0,
c->getHeight() - 35, 0xf0f6ff, 0xa0c0ff), -1, Chart::Transparent, 0xffffff, 0xffffff);
// Add a legend box at (50, 25) using horizontal layout. Use 10pts Arial Bold as font. Set the
// background and border color to Transparent.
c->addLegend(50, 25, false, "Arial Bold", 10)->setBackground(Chart::Transparent);
// Set axis label style to 8pts Arial Bold
c->xAxis()->setLabelStyle("Arial Bold", 8);
c->yAxis()->setLabelStyle("Arial Bold", 8);
// Set the axis stem to transparent
c->xAxis()->setColors(Chart::Transparent);
c->yAxis()->setColors(Chart::Transparent);
// Configure x-axis label format
c->xAxis()->setMultiFormat(Chart::StartOfYearFilter(), "{value|mm/yyyy} ",
Chart::StartOfMonthFilter(), "{value|mm}");
// Add axis title using 10pts Arial Bold Italic font
c->yAxis()->setTitle("USD millions", "Arial Bold Italic", 10);
// Add a line layer to the chart using a line width of 2 pixels.
LineLayer *layer = c->addLineLayer();
layer->setLineWidth(2);
// Add 3 data series to the line layer
layer->setXData(timeStamps);
layer->addDataSet(data0, 0xff3333, "Alpha");
layer->addDataSet(data1, 0x008800, "Beta");
layer->addDataSet(data2, 0x3333cc, "Gamma");
// Set the chart image to the QChartViewer
viewer->setChart(c);
}
//
// Draw track cursor when mouse is moving over plotarea
//
void TrackLabel::onMouseMovePlotArea(QMouseEvent *)
{
trackLineLabel((XYChart *)m_ChartViewer->getChart(), m_ChartViewer->getPlotAreaMouseX());
m_ChartViewer->updateDisplay();
// Hide the track cursor when the mouse leaves the plot area
m_ChartViewer->removeDynamicLayer("mouseLeavePlotArea");
}
//
// Draw track line with data labels
//
void TrackLabel::trackLineLabel(XYChart *c, int mouseX)
{
// Clear the current dynamic layer and get the DrawArea object to draw on it.
DrawArea *d = c->initDynamicLayer();
// The plot area object
PlotArea *plotArea = c->getPlotArea();
// Get the data x-value that is nearest to the mouse, and find its pixel coordinate.
double xValue = c->getNearestXValue(mouseX);
int xCoor = c->getXCoor(xValue);
// Draw a vertical track line at the x-position
d->vline(plotArea->getTopY(), plotArea->getBottomY(), xCoor,
d->dashLineColor(0x000000, 0x0101));
// Draw a label on the x-axis to show the track line position.
std::ostringstream xlabel;
xlabel << "<*font,bgColor=000000*> " << c->xAxis()->getFormattedLabel(xValue, "mmm dd, yyyy")
<< " <*/font*>";
TTFText *t = d->text(xlabel.str().c_str(), "Arial Bold", 8);
// Restrict the x-pixel position of the label to make sure it stays inside the chart image.
int xLabelPos = (std::max)(0, (std::min)(xCoor - t->getWidth() / 2, c->getWidth() - t->getWidth()));
t->draw(xLabelPos, plotArea->getBottomY() + 6, 0xffffff);
t->destroy();
// Iterate through all layers to draw the data labels
for (int i = 0; i < c->getLayerCount(); ++i) {
Layer *layer = c->getLayerByZ(i);
// The data array index of the x-value
int xIndex = layer->getXIndexOf(xValue);
// Iterate through all the data sets in the layer
for (int j = 0; j < layer->getDataSetCount(); ++j)
{
DataSet *dataSet = layer->getDataSetByZ(j);
const char *dataSetName = dataSet->getDataName();
// Get the color, name and position of the data label
int color = dataSet->getDataColor();
int yCoor = c->getYCoor(dataSet->getPosition(xIndex), dataSet->getUseYAxis());
// Draw a track dot with a label next to it for visible data points in the plot area
if ((yCoor >= plotArea->getTopY()) && (yCoor <= plotArea->getBottomY()) && (color !=
(int)Chart::Transparent) && dataSetName && *dataSetName)
{
d->circle(xCoor, yCoor, 4, 4, color, color);
std::ostringstream label;
label << "<*font,bgColor=" << std::hex << color << "*> "
<< c->formatValue(dataSet->getValue(xIndex), "{value|P4}") << " <*font*>";
t = d->text(label.str().c_str(), "Arial Bold", 8);
// Draw the label on the right side of the dot if the mouse is on the left side the
// chart, and vice versa. This ensures the label will not go outside the chart image.
if (xCoor <= (plotArea->getLeftX() + plotArea->getRightX()) / 2)
t->draw(xCoor + 5, yCoor, 0xffffff, Chart::Left);
else
t->draw(xCoor - 5, yCoor, 0xffffff, Chart::Right);
t->destroy();
}
}
}
}
[QML/Qt Quick version] qmldemo/tracklabel.qml
import QtQuick
import QtQuick.Window
import QtQuick.Controls
import advsofteng.com 1.0

Window {
    title: "Track Line with Axis Labels"
    visible: true
    modality: Qt.ApplicationModal
    width: viewer.width
    maximumWidth: viewer.width
    minimumWidth: viewer.width
    height: viewer.height
    maximumHeight: viewer.height
    minimumHeight: viewer.height

    // The backend implementation of this demo.
    TrackLabelDemo { id: demo }

    QmlChartViewer {
        id: viewer
        Component.onCompleted: demo.drawChart(this)
        // Update track cursor on mouse move
        onMouseMovePlotArea: demo.drawTrackCursor(this, chartMouseX)
    }
}
[QML/Qt Quick version] qmldemo/tracklabel.cpp
#include "tracklabel.h"
#include <sstream>


TrackLabel::TrackLabel(QObject *parent) : QObject(parent)
{
    m_currentChart = 0;
}

TrackLabel::~TrackLabel()
{
    delete m_currentChart;
}

//
// Draw the chart and display it in the given viewer
//
void TrackLabel::drawChart(QmlChartViewer *viewer)
{
    // Data for the chart as 3 random data series
    RanSeries r(127);
    DoubleArray data0 = r.getSeries(100, 100, -15, 15);
    DoubleArray data1 = r.getSeries(100, 150, -15, 15);
    DoubleArray data2 = r.getSeries(100, 200, -15, 15);
    DoubleArray timeStamps = r.getDateSeries(100, Chart::chartTime(2011, 1, 1), 86400);

    // Create a XYChart object of size 640 x 400 pixels
    XYChart *c = new XYChart(640, 400);

    // Add a title to the chart using 18 pts Times New Roman Bold Italic font
    c->addTitle("    Product Line Global Revenue", "Times New Roman Bold Italic", 18);

    // Set the plotarea at (50, 55) with width 70 pixels less than chart width, and height 90 pixels
    // less than chart height. Use a vertical gradient from light blue (f0f6ff) to sky blue (a0c0ff)
    // as background. Set border to transparent and grid lines to white (ffffff).
    c->setPlotArea(50, 55, c->getWidth() - 70, c->getHeight() - 90, c->linearGradientColor(0, 55, 0,
        c->getHeight() - 35, 0xf0f6ff, 0xa0c0ff), -1, Chart::Transparent, 0xffffff, 0xffffff);

    // Add a legend box at (50, 25) using horizontal layout. Use 10pts Arial Bold as font. Set the
    // background and border color to Transparent.
    c->addLegend(50, 25, false, "Arial Bold", 10)->setBackground(Chart::Transparent);

    // Set axis label style to 8pts Arial Bold
    c->xAxis()->setLabelStyle("Arial Bold", 8);
    c->yAxis()->setLabelStyle("Arial Bold", 8);

    // Set the axis stem to transparent
    c->xAxis()->setColors(Chart::Transparent);
    c->yAxis()->setColors(Chart::Transparent);

    // Configure x-axis label format
    c->xAxis()->setMultiFormat(Chart::StartOfYearFilter(), "{value|mm/yyyy} ",
        Chart::StartOfMonthFilter(), "{value|mm}");

    // Add axis title using 10pts Arial Bold Italic font
    c->yAxis()->setTitle("USD millions", "Arial Bold Italic", 10);

    // Add a line layer to the chart using a line width of 2 pixels.
    LineLayer *layer = c->addLineLayer();
    layer->setLineWidth(2);

    // Add 3 data series to the line layer
    layer->setXData(timeStamps);
    layer->addDataSet(data0, 0xff3333, "Alpha");
    layer->addDataSet(data1, 0x008800, "Beta");
    layer->addDataSet(data2, 0x3333cc, "Gamma");

    // Set the chart image to the QChartViewer
    viewer->setChart(m_currentChart = c);
}

//
// Draw track cursor when mouse is moving over plotarea
//
void TrackLabel::drawTrackCursor(QmlChartViewer *viewer, int mouseX)
{
    trackLineLabel((XYChart *)viewer->getChart(), mouseX);
    viewer->updateDisplay();

    // Hide the track cursor when the mouse leaves the plot area
    viewer->removeDynamicLayer("mouseLeavePlotArea");
}

//
// Draw track line with data labels
//
void TrackLabel::trackLineLabel(XYChart *c, int mouseX)
{
    // Clear the current dynamic layer and get the DrawArea object to draw on it.
    DrawArea *d = c->initDynamicLayer();

    // The plot area object
    PlotArea *plotArea = c->getPlotArea();

    // Get the data x-value that is nearest to the mouse, and find its pixel coordinate.
    double xValue = c->getNearestXValue(mouseX);
    int xCoor = c->getXCoor(xValue);

    // Draw a vertical track line at the x-position
    d->vline(plotArea->getTopY(), plotArea->getBottomY(), xCoor,
        d->dashLineColor(0x000000, 0x0101));

    // Draw a label on the x-axis to show the track line position.
    std::ostringstream xlabel;
    xlabel << "<*font,bgColor=000000*> " << c->xAxis()->getFormattedLabel(xValue, "mmm dd, yyyy")
        << " <*/font*>";
    TTFText *t = d->text(xlabel.str().c_str(), "Arial Bold", 8);

    // Restrict the x-pixel position of the label to make sure it stays inside the chart image.
    int xLabelPos = (std::max)(0, (std::min)(xCoor - t->getWidth() / 2, c->getWidth() - t->getWidth()));
    t->draw(xLabelPos, plotArea->getBottomY() + 6, 0xffffff);
    t->destroy();

    // Iterate through all layers to draw the data labels
    for (int i = 0; i < c->getLayerCount(); ++i) {
        Layer *layer = c->getLayerByZ(i);

        // The data array index of the x-value
        int xIndex = layer->getXIndexOf(xValue);

        // Iterate through all the data sets in the layer
        for (int j = 0; j < layer->getDataSetCount(); ++j)
        {
            DataSet *dataSet = layer->getDataSetByZ(j);
            const char *dataSetName = dataSet->getDataName();

            // Get the color, name and position of the data label
            int color = dataSet->getDataColor();
            int yCoor = c->getYCoor(dataSet->getPosition(xIndex), dataSet->getUseYAxis());

            // Draw a track dot with a label next to it for visible data points in the plot area
            if ((yCoor >= plotArea->getTopY()) && (yCoor <= plotArea->getBottomY()) && (color !=
                (int)Chart::Transparent) && dataSetName && *dataSetName)
            {
                d->circle(xCoor, yCoor, 4, 4, color, color);

                std::ostringstream label;
                label << "<*font,bgColor=" << std::hex << color << "*> "
                    << c->formatValue(dataSet->getValue(xIndex), "{value|P4}") << " <*font*>";
                t = d->text(label.str().c_str(), "Arial Bold", 8);

                // Draw the label on the right side of the dot if the mouse is on the left side the
                // chart, and vice versa. This ensures the label will not go outside the chart image.
                if (xCoor <= (plotArea->getLeftX() + plotArea->getRightX()) / 2)
                    t->draw(xCoor + 5, yCoor, 0xffffff, Chart::Left);
                else
                    t->draw(xCoor - 5, yCoor, 0xffffff, Chart::Right);

                t->destroy();
            }
        }
    }
}
© 2023 Advanced Software Engineering Limited. All rights reserved.