This example demonstrates data series that are unevenly spaced in the x dimension.
In ChartDirector, x coordinates for the data points are optional. If no x coordinates are provided for the data points, the x coordinates will be assumed to be the array indexes (0, 1, 2, 3 ...), and the data points would be evenly spaced in the x direction. Axis labels specified using
Axis.setLabels or
Axis.setLabels2 are also positioned using the array indexes as the x coordinates, so the labels will match with the data points.
In some applications, it may be necessary or more convenient to provide x coordinates for the data points. For example, if the data points are unevenly spaced, or if there are multiple data series with different data point spacing in the x direction, x coordinates are needed. In this case,
Layer.setXData or
Layer.setXData2 can be used to provide the x coordinates. By default, ChartDirector will then automatically determine the x-axis scale and labels, just like how the y-axis is handled. The axis scale and labels can also be specified by using various
Axis methods, such as
Axis.setLinearScale,
Axis.setLogScale and
Axis.setDateScale (please refer to
Axis for the full list).
Axis.setLabels or
Axis.setLabels2 should not be used if x coordinates are provided, as they use array indexes as the x coordinates, which is unlikely to be consistent with the provided x coordinates.
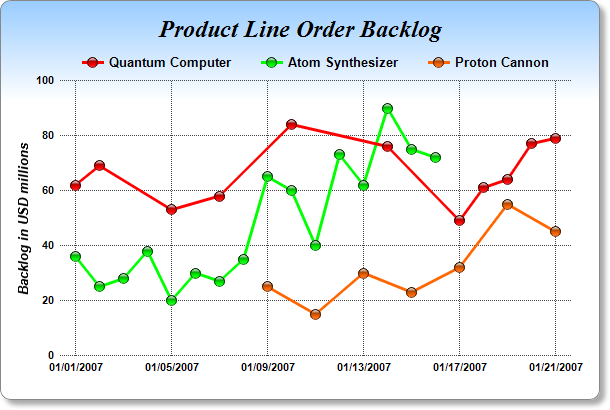
In this example, the red line has unevenly spaced x coordinates, which are provided using
Layer.setXData. Both the green and orange lines have evenly spaced x coordinates, but their spacing in the x direction differs. Their x coordinates are provided using
Layer.setXData2. Note that the lines start and end at different x coordinates, and they do not need to span the entire x-axis range. The x-axis in this example is automatically scaled.
The following is the command line version of the code in "cppdemo/unevenpoints". The MFC version of the code is in "mfcdemo/mfcdemo". The Qt Widgets version of the code is in "qtdemo/qtdemo". The QML/Qt Quick version of the code is in "qmldemo/qmldemo".
#include "chartdir.h"

int main(int argc, char *argv[])
{
    // Data points which more unevenly spaced in time
    double data0Y[] = {62, 69, 53, 58, 84, 76, 49, 61, 64, 77, 79};
    const int data0Y_size = (int)(sizeof(data0Y)/sizeof(*data0Y));
    double data0X[] = {Chart::chartTime(2007, 1, 1), Chart::chartTime(2007, 1, 2), Chart::chartTime(
        2007, 1, 5), Chart::chartTime(2007, 1, 7), Chart::chartTime(2007, 1, 10), Chart::chartTime(
        2007, 1, 14), Chart::chartTime(2007, 1, 17), Chart::chartTime(2007, 1, 18),
        Chart::chartTime(2007, 1, 19), Chart::chartTime(2007, 1, 20), Chart::chartTime(2007, 1, 21)}
        ;
    const int data0X_size = (int)(sizeof(data0X)/sizeof(*data0X));

    // Data points which are evenly spaced in a certain time range
    double data1Y[] = {36, 25, 28, 38, 20, 30, 27, 35, 65, 60, 40, 73, 62, 90, 75, 72};
    const int data1Y_size = (int)(sizeof(data1Y)/sizeof(*data1Y));
    double data1Start = Chart::chartTime(2007, 1, 1);
    double data1End = Chart::chartTime(2007, 1, 16);

    // Data points which are evenly spaced in another time range, in which the spacing is different
    // from the above series
    double data2Y[] = {25, 15, 30, 23, 32, 55, 45};
    const int data2Y_size = (int)(sizeof(data2Y)/sizeof(*data2Y));
    double data2Start = Chart::chartTime(2007, 1, 9);
    double data2End = Chart::chartTime(2007, 1, 21);

    // Create a XYChart object of size 600 x 400 pixels. Use a vertical gradient color from light
    // blue (99ccff) to white (ffffff) spanning the top 100 pixels as background. Set border to grey
    // (888888). Use rounded corners. Enable soft drop shadow.
    XYChart* c = new XYChart(600, 400);
    c->setBackground(c->linearGradientColor(0, 0, 0, 100, 0x99ccff, 0xffffff), 0x888888);
    c->setRoundedFrame();
    c->setDropShadow();

    // Add a title using 18pt Times New Roman Bold Italic font. Set top margin to 16 pixels.
    c->addTitle("Product Line Order Backlog", "Times New Roman Bold Italic", 18)->setMargin(0, 0,
        16, 0);

    // Set the plotarea at (60, 80) and of 510 x 275 pixels in size. Use transparent border and dark
    // grey (444444) dotted grid lines
    PlotArea* plotArea = c->setPlotArea(60, 80, 510, 275, -1, -1, Chart::Transparent,
        c->dashLineColor(0x444444, 0x0101), -1);

    // Add a legend box where the top-center is anchored to the horizontal center of the plot area
    // at y = 45. Use horizontal layout and 10 points Arial Bold font, and transparent background
    // and border.
    LegendBox* legendBox = c->addLegend(plotArea->getLeftX() + plotArea->getWidth() / 2, 45, false,
        "Arial Bold", 10);
    legendBox->setAlignment(Chart::TopCenter);
    legendBox->setBackground(Chart::Transparent, Chart::Transparent);

    // Set x-axis tick density to 75 pixels and y-axis tick density to 30 pixels. ChartDirector
    // auto-scaling will use this as the guidelines when putting ticks on the x-axis and y-axis.
    c->yAxis()->setTickDensity(30);
    c->xAxis()->setTickDensity(75);

    // Set all axes to transparent
    c->xAxis()->setColors(Chart::Transparent);
    c->yAxis()->setColors(Chart::Transparent);

    // Set the x-axis margins to 15 pixels, so that the horizontal grid lines can extend beyond the
    // leftmost and rightmost vertical grid lines
    c->xAxis()->setMargin(15, 15);

    // Set axis label style to 8pt Arial Bold
    c->xAxis()->setLabelStyle("Arial Bold", 8);
    c->yAxis()->setLabelStyle("Arial Bold", 8);
    c->yAxis2()->setLabelStyle("Arial Bold", 8);

    // Add axis title using 10pt Arial Bold Italic font
    c->yAxis()->setTitle("Backlog in USD millions", "Arial Bold Italic", 10);

    // Add the first data series
    LineLayer* layer0 = c->addLineLayer();
    layer0->addDataSet(DoubleArray(data0Y, data0Y_size), 0xff0000, "Quantum Computer"
        )->setDataSymbol(Chart::GlassSphere2Shape, 11);
    layer0->setXData(DoubleArray(data0X, data0X_size));
    layer0->setLineWidth(3);

    // Add the second data series
    LineLayer* layer1 = c->addLineLayer();
    layer1->addDataSet(DoubleArray(data1Y, data1Y_size), 0x00ff00, "Atom Synthesizer"
        )->setDataSymbol(Chart::GlassSphere2Shape, 11);
    layer1->setXData(data1Start, data1End);
    layer1->setLineWidth(3);

    // Add the third data series
    LineLayer* layer2 = c->addLineLayer();
    layer2->addDataSet(DoubleArray(data2Y, data2Y_size), 0xff6600, "Proton Cannon")->setDataSymbol(
        Chart::GlassSphere2Shape, 11);
    layer2->setXData(data2Start, data2End);
    layer2->setLineWidth(3);

    // Output the chart
    c->makeChart("unevenpoints.png");

    //free up resources
    delete c;

    return 0;
}
© 2023 Advanced Software Engineering Limited. All rights reserved.