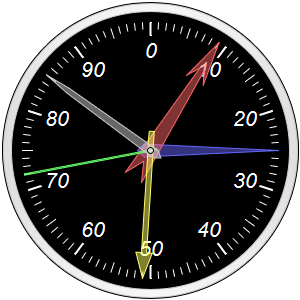
This example demonstrates adding multiple classical pointers of different styles to a meter.
For angular meters, classical pointers are added using
BaseMeter.addPointer, while new style pointers are added using
AngularMeter.addPointer2.
Comparing to new style pointers, classical angular pointers are thicker in shape. This enables them to express various shapes. They are designed to be pivoted to the center by a small pointer cap (the circle at the center). The classical pointer cap can be configured using
AngularMeter.setCap.
This example demonstrates the 5 built-in classical angular pointer shapes, configured using
MeterPointer.setShape. ChartDirector also supports custom shapes configured using
MeterPointer.setShape2.
[JSP Version] jspdemo/angularpointer.jsp
<%@page import="ChartDirector.*, java.util.*" %>
<%
// Create an AngularMeter object of size 300 x 300 pixels with transparent background
AngularMeter m = new AngularMeter(300, 300, Chart.Transparent);

// Set the default text and line colors to white (0xffffff)
m.setColor(Chart.TextColor, 0xffffff);
m.setColor(Chart.LineColor, 0xffffff);

// Center at (150, 150), scale radius = 128 pixels, scale angle 0 to 360 degrees
m.setMeter(150, 150, 128, 0, 360);

// Add a black (0x000000) circle with radius 148 pixels as background
m.addRing(0, 148, 0x000000);

// Add a ring between radii 139 and 147 pixels using the silver color with a light grey (0xcccccc)
// edge as border
m.addRing(139, 147, Chart.silverColor(), 0xcccccc);

// Meter scale is 0 - 100, with major/minor/micro ticks every 10/5/1 units
m.setScale(0, 100, 10, 5, 1);

// Set the scale label style to 16pt Arial Italic. Set the major/minor/micro tick lengths to 13/10/7
// pixels pointing inwards, and their widths to 2/1/1 pixels.
m.setLabelStyle("Arial Italic", 16);
m.setTickLength(-13, -10, -7);
m.setLineWidth(0, 2, 1, 1);

// Add a semi-transparent blue (0x7f6666ff) pointer using the default shape
m.addPointer(25, 0x7f6666ff, 0x6666ff);

// Add a semi-transparent red (0x7fff6666) pointer using the arrow shape
m.addPointer(9, 0x7fff6666, 0xff6666).setShape(Chart.ArrowPointer2);

// Add a semi-transparent yellow (0x7fffff66) pointer using another arrow shape
m.addPointer(51, 0x7fffff66, 0xffff66).setShape(Chart.ArrowPointer);

// Add a semi-transparent green (0x7f66ff66) pointer using the line shape
m.addPointer(72, 0x7f66ff66, 0x66ff66).setShape(Chart.LinePointer);

// Add a semi-transparent grey (0x7fcccccc) pointer using the pencil shape
m.addPointer(85, 0x7fcccccc, 0xcccccc).setShape(Chart.PencilPointer);

// Output the chart
WebChartViewer viewer = new WebChartViewer(request, "chart1");
viewer.setChart(m, Chart.SVG);
%>
<!DOCTYPE html>
<html>
<head>
    <title>Angular Meter Pointers (1)</title>
    <!-- Include ChartDirector Javascript Library to support chart interactions -->
    <script type="text/javascript" src="cdjcv.js"></script>
</head>
<body style="margin:5px 0px 0px 5px">
    <div style="font:bold 18pt verdana;">
        Angular Meter Pointers (1)
    </div>
    <hr style="border:solid 1px #000080; background:#000080" />
    <div style="font:10pt verdana; margin-bottom:1.5em">
        <a href="viewsource.jsp?file=<%=request.getServletPath()%>">View Source Code</a>
    </div>
    <!-- ****** Here is the chart image ****** -->
    <%= viewer.renderHTML(response) %>
</body>
</html>
© 2021 Advanced Software Engineering Limited. All rights reserved.