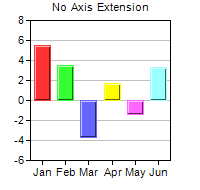
This example demonstrates how to control auto-scaling.
By default, ChartDirector auto-scales all axes. The
Axis.setAutoScale method controls the top extension, bottom extension and the zero affinity parameters that ChartDirector uses during auto-scaling. The first two parameters determine the amount of top and bottom margins to reserve during auto-scaling, while the last parameter determines when the axis should start from the origin (0).
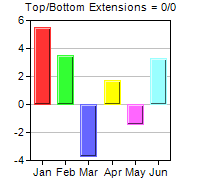
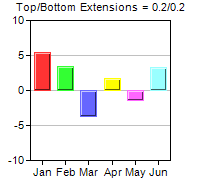
The first 3 charts demonstrate the effects of different top/bottom extensions.
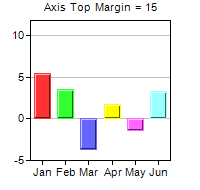
The 4th chart demonstrates that one could exclude a segment on the ends of an axis from scaling using
Axis.setMargin.
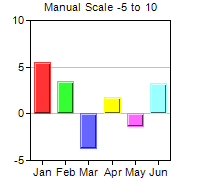
The 5th chart demonstrates manual scaling instead of auto-scaling. In manual scaling, the axis scale is explicitly provided by using
Axis.setLinearScale,
Axis.setLinearScale2,
Axis.setLogScale,
Axis.setLogScale2,
Axis.setDateScale or
Axis.setDateScale2.
[JSP Version] jspdemo/axisscale.jsp
<%@page import="ChartDirector.*, java.util.*" %>
<%!
// Function to create the demo charts
void createChart(WebChartViewer viewer, int chartIndex)
{
    // The data for the chart
    double[] data = {5.5, 3.5, -3.7, 1.7, -1.4, 3.3};
    String[] labels = {"Jan", "Feb", "Mar", "Apr", "May", "Jun"};

    // Create a XYChart object of size 200 x 190 pixels
    XYChart c = new XYChart(200, 190);

    // Set the plot area at (30, 20) and of size 140 x 140 pixels
    c.setPlotArea(30, 20, 140, 140);

    // Configure the axis as according to the input parameter
    if (chartIndex == 0) {
        c.addTitle("No Axis Extension", "Arial", 8);
    } else if (chartIndex == 1) {
        c.addTitle("Top/Bottom Extensions = 0/0", "Arial", 8);
        // Reserve 20% margin at top of plot area when auto-scaling
        c.yAxis().setAutoScale(0, 0);
    } else if (chartIndex == 2) {
        c.addTitle("Top/Bottom Extensions = 0.2/0.2", "Arial", 8);
        // Reserve 20% margin at top and bottom of plot area when auto-scaling
        c.yAxis().setAutoScale(0.2, 0.2);
    } else if (chartIndex == 3) {
        c.addTitle("Axis Top Margin = 15", "Arial", 8);
        // Reserve 15 pixels at top of plot area
        c.yAxis().setMargin(15);
    } else {
        c.addTitle("Manual Scale -5 to 10", "Arial", 8);
        // Set the y axis to scale from -5 to 10, with ticks every 5 units
        c.yAxis().setLinearScale(-5, 10, 5);
    }

    // Set the labels on the x axis
    c.xAxis().setLabels(labels);

    // Add a color bar layer using the given data. Use a 1 pixel 3D border for the bars.
    c.addBarLayer3(data).setBorderColor(-1, 1);

    // Output the chart
    viewer.setChart(c, Chart.SVG);

    // Include tool tip for the chart
    viewer.setImageMap(c.getHTMLImageMap("", "", "title='ROI for {xLabel}: {value}%'"));
}
%>
<%
// This example includes 5 charts
WebChartViewer[] viewers = new WebChartViewer[5];
for (int i = 0; i < viewers.length; ++i) {
    viewers[i] = new WebChartViewer(request, "chart" + i);
    createChart(viewers[i], i);
}
%>
<!DOCTYPE html>
<html>
<head>
    <title>Y-Axis Scaling</title>
    <!-- Include ChartDirector Javascript Library to support chart interactions -->
    <script type="text/javascript" src="cdjcv.js"></script>
</head>
<body style="margin:5px 0px 0px 5px">
    <div style="font:bold 18pt verdana;">
        Y-Axis Scaling
    </div>
    <hr style="border:solid 1px #000080; background:#000080" />
    <div style="font:10pt verdana; margin-bottom:1.5em">
        <a href="viewsource.jsp?file=<%=request.getServletPath()%>">View Source Code</a>
    </div>
    <!-- ****** Here are the chart images ****** -->
    <%
        for (int i = 0; i < viewers.length; ++i) {
            out.write(viewers[i].renderHTML(response));
            out.write(" ");
        }
    %>
</body>
</html>
© 2021 Advanced Software Engineering Limited. All rights reserved.