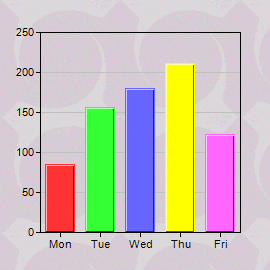
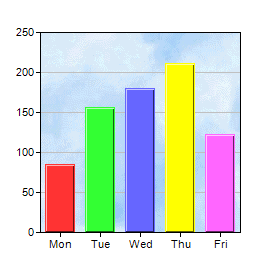
This example demonstrates some of the background effects supported by ChartDirector.
ChartDirector supports using an image file as the wallpaper of the chart image background with
BaseChart.setWallpaper, and as the plot area background with
PlotArea.setBackground2.
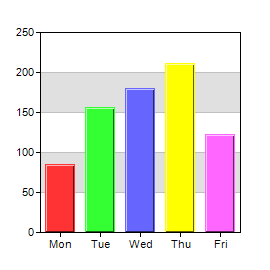
In addition to wallpapers, ChartDirector supports alternating plot area background colors using
PlotArea.setBackground and
PlotArea.setAltBgColor.
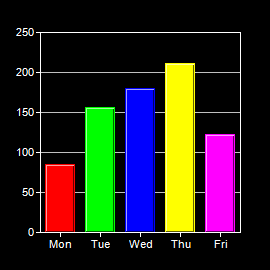
You can switch the default colors to using a dark background with white lines and text in one step by changing the color palette to a
whiteOnBlackPalette using
BaseChart.setColors.
[JSP Version] jspdemo/background.jsp
<%@page import="ChartDirector.*, java.util.*" %>
<%!
// Function to create the demo charts
void createChart(WebChartViewer viewer, int chartIndex)
{
    // The data for the chart
    double[] data = {85, 156, 179.5, 211, 123};
    String[] labels = {"Mon", "Tue", "Wed", "Thu", "Fri"};

    // Create a XYChart object of size 270 x 270 pixels
    XYChart c = new XYChart(270, 270);

    // Set the plot area at (40, 32) and of size 200 x 200 pixels
    PlotArea plotarea = c.setPlotArea(40, 32, 200, 200);

    // Set the background style based on the input parameter
    if (chartIndex == 0) {
        // Has wallpaper image
        c.setWallpaper("tile.png");
    } else if (chartIndex == 1) {
        // Use a background image as the plot area background
        plotarea.setBackground2("bg.png");
    } else if (chartIndex == 2) {
        // Use white (0xffffff) and grey (0xe0e0e0) as two alternate plotarea background colors
        plotarea.setBackground(0xffffff, 0xe0e0e0);
    } else {
        // Use a dark background palette
        c.setColors(Chart.whiteOnBlackPalette);
    }

    // Set the labels on the x axis
    c.xAxis().setLabels(labels);

    // Add a color bar layer using the given data. Use a 1 pixel 3D border for the bars.
    c.addBarLayer3(data).setBorderColor(-1, 1);

    // Output the chart
    viewer.setChart(c, Chart.SVG);

    // Include tool tip for the chart
    viewer.setImageMap(c.getHTMLImageMap("", "", "title='Revenue for {xLabel}: US${value}K'"));
}
%>
<%
// This example includes 4 charts
WebChartViewer[] viewers = new WebChartViewer[4];
for (int i = 0; i < viewers.length; ++i) {
    viewers[i] = new WebChartViewer(request, "chart" + i);
    createChart(viewers[i], i);
}
%>
<!DOCTYPE html>
<html>
<head>
    <title>Background and Wallpaper</title>
    <!-- Include ChartDirector Javascript Library to support chart interactions -->
    <script type="text/javascript" src="cdjcv.js"></script>
</head>
<body style="margin:5px 0px 0px 5px">
    <div style="font:bold 18pt verdana;">
        Background and Wallpaper
    </div>
    <hr style="border:solid 1px #000080; background:#000080" />
    <div style="font:10pt verdana; margin-bottom:1.5em">
        <a href="viewsource.jsp?file=<%=request.getServletPath()%>">View Source Code</a>
    </div>
    <!-- ****** Here are the chart images ****** -->
    <%
        for (int i = 0; i < viewers.length; ++i) {
            out.write(viewers[i].renderHTML(response));
            out.write(" ");
        }
    %>
</body>
</html>
© 2021 Advanced Software Engineering Limited. All rights reserved.