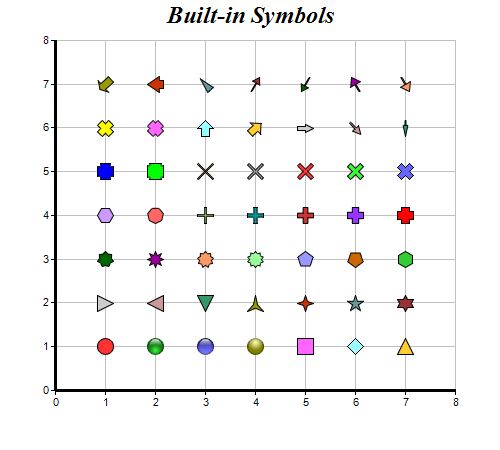
This example demonstrates the built-in symbols supported by ChartDirector.
ChartDirector 7.0 (Java Edition)
Built-In Symbols
Source Code Listing
<%@page import="ChartDirector.*, java.util.*" %>
<%
// Some ChartDirector built-in symbols
int[] symbols = {Chart.CircleShape, Chart.GlassSphereShape, Chart.GlassSphere2Shape,
    Chart.SolidSphereShape, Chart.SquareShape, Chart.DiamondShape, Chart.TriangleShape,
    Chart.RightTriangleShape, Chart.LeftTriangleShape, Chart.InvertedTriangleShape, Chart.StarShape(
    3), Chart.StarShape(4), Chart.StarShape(5), Chart.StarShape(6), Chart.StarShape(7),
    Chart.StarShape(8), Chart.StarShape(9), Chart.StarShape(10), Chart.PolygonShape(5),
    Chart.Polygon2Shape(5), Chart.PolygonShape(6), Chart.Polygon2Shape(6), Chart.Polygon2Shape(7),
    Chart.CrossShape(0.1), Chart.CrossShape(0.2), Chart.CrossShape(0.3), Chart.CrossShape(0.4),
    Chart.CrossShape(0.5), Chart.CrossShape(0.6), Chart.CrossShape(0.7), Chart.Cross2Shape(0.1),
    Chart.Cross2Shape(0.2), Chart.Cross2Shape(0.3), Chart.Cross2Shape(0.4), Chart.Cross2Shape(0.5),
    Chart.Cross2Shape(0.6), Chart.Cross2Shape(0.7), Chart.ArrowShape(), Chart.ArrowShape(45),
    Chart.ArrowShape(90, 0.5), Chart.ArrowShape(135, 0.5, 0.2), Chart.ArrowShape(180, 0.3, 0.2, 0.3
    ), Chart.ArrowShape(225, 1, 0.5, 0.7), Chart.ArrowShape(270, 1, 0.5, 0.25), Chart.ArrowShape(
    315, 0.5, 0.5, 0), Chart.ArrowShape(30, 0.5, 0.1, 0.6), Chart.ArrowShape(210, 0.5, 0.1, 0.6),
    Chart.ArrowShape(330, 0.7, 0.1), Chart.ArrowShape(150, 0.7, 0.1)};

// Create a XYChart object of size 500 x 450 pixels
XYChart c = new XYChart(500, 450);

// Set the plotarea at (55, 40) and of size 400 x 350 pixels, with a light grey border (0xc0c0c0).
// Turn on both horizontal and vertical grid lines with light grey color (0xc0c0c0)
c.setPlotArea(55, 40, 400, 350, -1, -1, 0xc0c0c0, 0xc0c0c0, -1);

// Add a title to the chart using 18pt Times Bold Itatic font.
c.addTitle("Built-in Symbols", "Times New Roman Bold Italic", 18);

// Set the axes line width to 3 pixels
c.xAxis().setWidth(3);
c.yAxis().setWidth(3);

// Ensure the ticks are at least 1 unit part (integer ticks)
c.xAxis().setMinTickInc(1);
c.yAxis().setMinTickInc(1);

// Add each symbol as a separate scatter layer.
for(int i = 0; i < symbols.length; ++i) {
    c.addScatterLayer(new double[]{i % 7 + 1.0}, new double[]{i / 7 + 1.0}, "", symbols[i], 17);
}

// Output the chart
WebChartViewer viewer = new WebChartViewer(request, "chart1");
viewer.setChart(c, Chart.SVG);

// Include tool tip for the chart
viewer.setImageMap(c.getHTMLImageMap("", "", "title='(x, y) = ({x}, {value})'"));
%>
<!DOCTYPE html>
<html>
<head>
    <title>Built-in Symbols</title>
    <!-- Include ChartDirector Javascript Library to support chart interactions -->
    <script type="text/javascript" src="cdjcv.js"></script>
</head>
<body style="margin:5px 0px 0px 5px">
    <div style="font:bold 18pt verdana;">
        Built-in Symbols
    </div>
    <hr style="border:solid 1px #000080; background:#000080" />
    <div style="font:10pt verdana; margin-bottom:1.5em">
        <a href="viewsource.jsp?file=<%=request.getServletPath()%>">View Source Code</a>
    </div>
    <!-- ****** Here is the chart image ****** -->
    <%= viewer.renderHTML(response) %>
</body>
</html>