[JSP Version] jspdemo/circularbarmeter.jsp
<%@page import="ChartDirector.*, java.util.*" %>
<%!
// Function to create the demo charts
void createChart(WebChartViewer viewer, int chartIndex)
{
// The value to display on the meter
double value = 77;
// The meter radius and angle
int radius = 50;
double angle = value * 360.0 / 100;
// Create an AngularMeter with transparent background
AngularMeter m = new AngularMeter(radius * 2 + 10, radius * 2 + 10, Chart.Transparent);
// Set the center, radius and angular range of the meter
m.setMeter(m.getWidth() / 2, m.getHeight() / 2, radius, 0, 360);
// For circular bar meters, we do not need pointer or graduation, so we hide them.
m.setMeterColors(Chart.Transparent, Chart.Transparent, Chart.Transparent);
m.setCap(0, Chart.Transparent);
//
// This example demonstrates several coloring styles
//
// Thd default fill and blank colors
int fillColor = 0x6699ff;
int blankColor = 0xeeeeee;
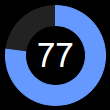
if (chartIndex >= 4) {
// Use dark background style
m.setColors(Chart.whiteOnBlackPalette);
blankColor = 0x222222;
}
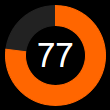
if (chartIndex % 4 == 1) {
// Alternative fill color
fillColor = 0xff6600;
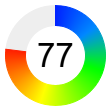
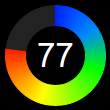
} else if (chartIndex % 4 == 2) {
// Use a smooth color scale as the fill color
int[] smoothColorScale = {0, 0x0022ff, 15, 0x0088ff, 30, 0x00ff00, 55, 0xffff00, 80,
0xff0000, 100, 0xff0000};
fillColor = m.getDrawArea().angleGradientColor(m.getWidth() / 2, m.getHeight() / 2, 0, 360,
radius, radius - 20, smoothColorScale);
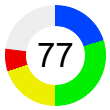
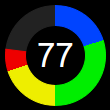
} else if (chartIndex % 4 == 3) {
// Use a step color scale as the fill color
int[] stepColorScale = {0, 0x0044ff, 20, 0x00ee00, 50, 0xeeee00, 70, 0xee0000, 100};
fillColor = m.getDrawArea().angleGradientColor(m.getWidth() / 2, m.getHeight() / 2, 0, 360,
radius, radius - 20, stepColorScale);
}
// Draw the blank part of the circular bar
if (angle < 360) {
m.addRingSector(radius, radius - 20, angle, 360, blankColor);
}
// Draw the fill part of the circular bar
if (angle > 0) {
m.addRingSector(radius, radius - 20, 0, angle, fillColor);
}
// Add a label at the center to display the value
m.addText(m.getWidth() / 2, m.getHeight() / 2, m.formatValue(value, "{value}"), "Arial", 25,
Chart.TextColor, Chart.Center).setMargin(0);
// Output the chart
viewer.setChart(m, Chart.SVG);
}
%>
<%
// This example includes 8 charts
WebChartViewer[] viewers = new WebChartViewer[8];
for (int i = 0; i < viewers.length; ++i) {
viewers[i] = new WebChartViewer(request, "chart" + i);
createChart(viewers[i], i);
}
%>
<!DOCTYPE html>
<html>
<head>
<title>Circular Bar Meters</title>
<!-- Include ChartDirector Javascript Library to support chart interactions -->
<script type="text/javascript" src="cdjcv.js"></script>
</head>
<body style="margin:5px 0px 0px 5px">
<div style="font:bold 18pt verdana;">
Circular Bar Meters
</div>
<hr style="border:solid 1px #000080; background:#000080" />
<div style="font:10pt verdana; margin-bottom:1.5em">
<a href="viewsource.jsp?file=<%=request.getServletPath()%>">View Source Code</a>
</div>
<!-- ****** Here are the chart images ****** -->
<%
for (int i = 0; i < viewers.length; ++i) {
out.write(viewers[i].renderHTML(response));
out.write(" ");
}
%>
</body>
</html>
© 2021 Advanced Software Engineering Limited. All rights reserved.