This example demonstrates loading external image files as data symbols by using DataSet.setDataSymbol2.
ChartDirector 7.0 (Java Edition)
Custom Symbols
Source Code Listing
<%@page import="ChartDirector.*, java.util.*" %>
<%
// The data for the chart
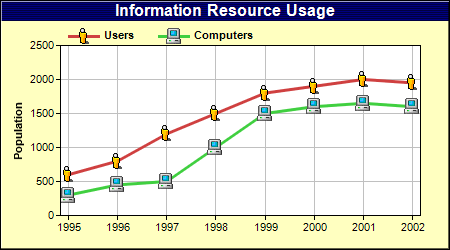
double[] data0 = {600, 800, 1200, 1500, 1800, 1900, 2000, 1950};
double[] data1 = {300, 450, 500, 1000, 1500, 1600, 1650, 1600};
// The labels for the chart
String[] labels = {"1995", "1996", "1997", "1998", "1999", "2000", "2001", "2002"};
// Create a XYChart object of size 450 x 250 pixels, with a pale yellow (0xffffc0) background, a
// black border, and 1 pixel 3D border effect.
XYChart c = new XYChart(450, 250, 0xffffc0, 0, 1);
// Set the plotarea at (60, 45) and of size 360 x 170 pixels, using white (0xffffff) as the plot
// area background color. Turn on both horizontal and vertical grid lines with light grey color
// (0xc0c0c0)
c.setPlotArea(60, 45, 360, 170, 0xffffff, -1, -1, 0xc0c0c0, -1);
// Add a legend box at (60, 20) (top of the chart) with horizontal layout. Use 8pt Arial Bold font.
// Set the background and border color to Transparent.
c.addLegend(60, 20, false, "Arial Bold", 8).setBackground(Chart.Transparent);
// Add a title to the chart using 12pt Arial Bold/white font with a dark blue (000060) background.
c.addTitle("Information Resource Usage", "Arial Bold", 12, 0xffffff).setBackground(0x000060);
// Set the labels on the x axis
c.xAxis().setLabels(labels);
// Reserve 8 pixels margins at both side of the x axis to avoid the first and last symbols drawing
// outside of the plot area
c.xAxis().setMargin(8, 8);
// Add a title to the y axis
c.yAxis().setTitle("Population");
// Add a line layer to the chart
LineLayer layer = c.addLineLayer2();
// Add the first line using small_user.png as the symbol.
layer.addDataSet(data0, 0xcf4040, "Users").setDataSymbol2("small_user.png");
// Add the first line using small_computer.png as the symbol.
layer.addDataSet(data1, 0x40cf40, "Computers").setDataSymbol2("small_computer.png");
// Set the line width to 3 pixels
layer.setLineWidth(3);
// Output the chart
WebChartViewer viewer = new WebChartViewer(request, "chart1");
viewer.setChart(c, Chart.SVG);
// Include tool tip for the chart
viewer.setImageMap(c.getHTMLImageMap("", "", "title='Number of {dataSetName} at {xLabel}: {value}'")
);
%>
<!DOCTYPE html>
<html>
<head>
<title>Custom Symbols</title>
<!-- Include ChartDirector Javascript Library to support chart interactions -->
<script type="text/javascript" src="cdjcv.js"></script>
</head>
<body style="margin:5px 0px 0px 5px">
<div style="font:bold 18pt verdana;">
Custom Symbols
</div>
<hr style="border:solid 1px #000080; background:#000080" />
<div style="font:10pt verdana; margin-bottom:1.5em">
<a href="viewsource.jsp?file=<%=request.getServletPath()%>">View Source Code</a>
</div>
<!-- ****** Here is the chart image ****** -->
<%= viewer.renderHTML(response) %>
</body>
</html>