The Interactive Financial Chart is implemented in two parts - "financedemo.jsp" for the containing web page, and "financedemochart.jsp" for the charting page.
The containing web page "financedemo.jsp" is basically just a standard HTML Form. When the "Update Chart" button is pressed, instead of posting to the server, a client side Javascript function is activated. This function combines all Form elements into a query string, appends it to the charting URL "financedemochart.jsp" and uses it to update the <IMG> tag.
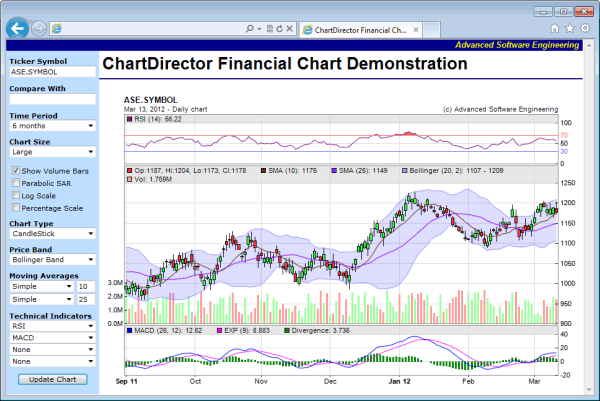
The "financedemochart.jsp" draws the finance chart according to the query parameters, which reflects user selections, and outputs the chart to the <IMG> tag.
The "financedemochart.jsp" contains two key parts.
- The get15MinData, getDailyData, getWeeklyData and getMonthlyData functions are for retrieving stock data. In this example, they just retrieve data from a random number generator. You may replace the code in these functions with your own code to get data from your data source.
- The drawChart function is the real charting code. It creates a FinanceChart object, sets data to it, and configures it according to query parameters.
[JSP Version] jspdemo/financedemo.jsp
<!DOCTYPE html>
<html>
<head>
<title>ChartDirector Financial Chart Demonstration</title>
<style>
.inputtitle {font:11px verdana; margin:10px 5px;}
.input {font:11px verdana}
</style>
<script language="Javascript">

//Update the chart according to user selection
function updateChart()
{
    //
    //we encode the values of all form elements as query parameters
    //
    var elements = document.getElementById("Form1").elements;
    var url = "financedemochart.jsp";
    url += (url.indexOf('?') < 0) ? '?' : '&';
    for (var i = 0; i < elements.length; ++i)
    {
        var e = elements[i];
        if (e.type == "checkbox")
            url = url + e.id + "=" + (e.checked ? "1" : "0") + "&";
        else
            url = url + e.id + "=" + escape(e.value) + "&";
    }

    //Now we update the URL of the image to update the chart
    document.getElementById("ChartImage").src = url;
}

</script>
</head>
<body style="margin:0px" onLoad="updateChart();">
<table style="border:0px; padding:0px; border-spacing:0px;">
    <tr>
        <td align="right" colspan="2" style="background:#000088">
            <div style="padding:0px 3px 2px 0px; font:bold italic 10pt arial;">
                <a style="color:#ffff00; text-decoration:none" href="http://www.advsofteng.com">
                    Advanced Software Engineering
                </a>
            </div>
        </td>
    </tr>
    <tr valign="top">
        <td style="width:150px; background:#bbddff">
            <form id="Form1" action="javascript:updateChart()">
            <div class="inputtitle">
                <b>Ticker Symbol</b><br />
                <input id="TickerSymbol" name="TickerSymbol" class="input" style="width:140px;" value="ASE.SYMBOL">
            </div>
            <div class="inputtitle">
                <b>Compare With</b><br />
                <input id="CompareWith" name="CompareWith" class="input" style="width:140px;" value="">
            </div>
            <div class="inputtitle">
                <b>Time Period</b><br />
                <select id="TimeRange" name="TimeRange" class="input" style="width:140px;">
                    <option value="1">1 day</option>
                    <option value="2">2 days</option>
                    <option value="5">5 days</option>
                    <option value="10">10 days</option>
                    <option value="30">1 month</option>
                    <option value="60">2 months</option>
                    <option value="90">3 months</option>
                    <option value="180" selected>6 months</option>
                    <option value="360">1 year</option>
                    <option value="720">2 years</option>
                    <option value="1080">3 years</option>
                    <option value="1440">4 years</option>
                    <option value="1800">5 years</option>
                    <option value="3600">10 years</option>
                </select>
            </div>
            <div class="inputtitle">
                <b>Chart Size</b><br />
                <select id="ChartSize" name="ChartSize" class="input" style="width:140px;">
                    <option value="S">Small</option>
                    <option value="M">Medium</option>
                    <option value="L" selected>Large</option>
                    <option value="H">Huge</option>
                </select><br />
            </div>
            <div class="inputtitle">
                <input type="checkbox" id="Volume" name="Volume" checked><label for="Volume">Show Volume Bars</label><br />
                <input type="checkbox" id="ParabolicSAR" name="ParabolicSAR"><label for="ParabolicSAR">Parabolic SAR</label><br />
                <input type="checkbox" id="LogScale" name="LogScale"><label for="LogScale">Log Scale</label><br />
                <input type="checkbox" id="PercentageScale" name="PercentageScale"><label for="PercentageScale">Percentage Scale</label><br />
            </div>
            <div class="inputtitle">
                <b>Chart Type</b><br />
                <select id="ChartType" name="ChartType" class="input" style="width:140px;">
                    <option value="None">None</option>
                    <option value="CandleStick" selected>CandleStick</option>
                    <option value="Close">Closing Price</option>
                    <option value="Median">Median Price</option>
                    <option value="OHLC">OHLC</option>
                    <option value="TP">Typical Price</option>
                    <option value="WC">Weighted Close</option>
                </select>
            </div>
            <div class="inputtitle">
                <b>Price Band</b><br />
                <select id="Band" name="Band" class="input" style="width:140px;">
                    <option value="None">None</option>
                    <option value="BB" selected>Bollinger Band</option>
                    <option value="DC">Donchian Channel</option>
                    <option value="Envelop">Envelop (SMA 20 +/- 10%)</option>
                </select>
            </div>
            <div class="inputtitle">
                <b>Moving Averages</b><br />
                <nobr><select id="avgType1" name="avgType1" class="input" style="width:105px;">
                    <option value="None">None</option>
                    <option value="SMA" selected>Simple</option>
                    <option value="EMA">Exponential</option>
                    <option value="TMA">Triangular</option>
                    <option value="WMA">Weighted</option>
                </select>
                <input id="movAvg1" name="movAvg1" class="input" style="width:30px;" value="10"></nobr><br />
                <nobr><select id="avgType2" name="avgType2" class="input" style="width:105px;">
                    <option value="None">None</option>
                    <option value="SMA" selected>Simple</option>
                    <option value="EMA">Exponential</option>
                    <option value="TMA">Triangular</option>
                    <option value="WMA">Weighted</option>
                </select>
                <input id="movAvg2" name="movAvg2" class="input" style="width:30px;" value="25"></nobr><br />
            </div>
            <div class="inputtitle">
                <b>Technical Indicators</b><br />
                <select id="Indicator1" name="Indicator1" class="input" style="width:140px;">
                    <option value="None">None</option>
                    <option value="AccDist">Accumulation/Distribution</option>
                    <option value="AroonOsc">Aroon Oscillator</option>
                    <option value="Aroon">Aroon Up/Down</option>
                    <option value="ADX">Avg Directional Index</option>
                    <option value="ATR">Avg True Range</option>
                    <option value="BBW">Bollinger Band Width</option>
                    <option value="CMF">Chaikin Money Flow</option>
                    <option value="COscillator">Chaikin Oscillator</option>
                    <option value="CVolatility">Chaikin Volatility</option>
                    <option value="CLV">Close Location Value</option>
                    <option value="CCI">Commodity Channel Index</option>
                    <option value="DPO">Detrended Price Osc</option>
                    <option value="DCW">Donchian Channel Width</option>
                    <option value="EMV">Ease of Movement</option>
                    <option value="FStoch">Fast Stochastic</option>
                    <option value="MACD">MACD</option>
                    <option value="MDX">Mass Index</option>
                    <option value="Momentum">Momentum</option>
                    <option value="MFI">Money Flow Index</option>
                    <option value="NVI">Neg Volume Index</option>
                    <option value="OBV">On Balance Volume</option>
                    <option value="Performance">Performance</option>
                    <option value="PPO">% Price Oscillator</option>
                    <option value="PVO">% Volume Oscillator</option>
                    <option value="PVI">Pos Volume Index</option>
                    <option value="PVT">Price Volume Trend</option>
                    <option value="ROC">Rate of Change</option>
                    <option value="RSI" selected>RSI</option>
                    <option value="SStoch">Slow Stochastic</option>
                    <option value="StochRSI">StochRSI</option>
                    <option value="TRIX">TRIX</option>
                    <option value="UO">Ultimate Oscillator</option>
                    <option value="Vol">Volume</option>
                    <option value="WilliamR">William's %R</option>
                </select><br />
                <select id="Indicator2" name="Indicator2" class="input" style="width:140px;">
                    <option value="None">None</option>
                    <option value="AccDist">Accumulation/Distribution</option>
                    <option value="AroonOsc">Aroon Oscillator</option>
                    <option value="Aroon">Aroon Up/Down</option>
                    <option value="ADX">Avg Directional Index</option>
                    <option value="ATR">Avg True Range</option>
                    <option value="BBW">Bollinger Band Width</option>
                    <option value="CMF">Chaikin Money Flow</option>
                    <option value="COscillator">Chaikin Oscillator</option>
                    <option value="CVolatility">Chaikin Volatility</option>
                    <option value="CLV">Close Location Value</option>
                    <option value="CCI">Commodity Channel Index</option>
                    <option value="DPO">Detrended Price Osc</option>
                    <option value="DCW">Donchian Channel Width</option>
                    <option value="EMV">Ease of Movement</option>
                    <option value="FStoch">Fast Stochastic</option>
                    <option value="MACD" selected>MACD</option>
                    <option value="MDX">Mass Index</option>
                    <option value="Momentum">Momentum</option>
                    <option value="MFI">Money Flow Index</option>
                    <option value="NVI">Neg Volume Index</option>
                    <option value="OBV">On Balance Volume</option>
                    <option value="Performance">Performance</option>
                    <option value="PPO">% Price Oscillator</option>
                    <option value="PVO">% Volume Oscillator</option>
                    <option value="PVI">Pos Volume Index</option>
                    <option value="PVT">Price Volume Trend</option>
                    <option value="ROC">Rate of Change</option>
                    <option value="RSI">RSI</option>
                    <option value="SStoch">Slow Stochastic</option>
                    <option value="StochRSI">StochRSI</option>
                    <option value="TRIX">TRIX</option>
                    <option value="UO">Ultimate Oscillator</option>
                    <option value="Vol">Volume</option>
                    <option value="WilliamR">William's %R</option>
                </select><br />
                <select id="Indicator3" name="Indicator3" class="input" style="width:140px;">
                    <option value="None" selected>None</option>
                    <option value="AccDist">Accumulation/Distribution</option>
                    <option value="AroonOsc">Aroon Oscillator</option>
                    <option value="Aroon">Aroon Up/Down</option>
                    <option value="ADX">Avg Directional Index</option>
                    <option value="ATR">Avg True Range</option>
                    <option value="BBW">Bollinger Band Width</option>
                    <option value="CMF">Chaikin Money Flow</option>
                    <option value="COscillator">Chaikin Oscillator</option>
                    <option value="CVolatility">Chaikin Volatility</option>
                    <option value="CLV">Close Location Value</option>
                    <option value="CCI">Commodity Channel Index</option>
                    <option value="DPO">Detrended Price Osc</option>
                    <option value="DCW">Donchian Channel Width</option>
                    <option value="EMV">Ease of Movement</option>
                    <option value="FStoch">Fast Stochastic</option>
                    <option value="MACD">MACD</option>
                    <option value="MDX">Mass Index</option>
                    <option value="Momentum">Momentum</option>
                    <option value="MFI">Money Flow Index</option>
                    <option value="NVI">Neg Volume Index</option>
                    <option value="OBV">On Balance Volume</option>
                    <option value="Performance">Performance</option>
                    <option value="PPO">% Price Oscillator</option>
                    <option value="PVO">% Volume Oscillator</option>
                    <option value="PVI">Pos Volume Index</option>
                    <option value="PVT">Price Volume Trend</option>
                    <option value="ROC">Rate of Change</option>
                    <option value="RSI">RSI</option>
                    <option value="SStoch">Slow Stochastic</option>
                    <option value="StochRSI">StochRSI</option>
                    <option value="TRIX">TRIX</option>
                    <option value="UO">Ultimate Oscillator</option>
                    <option value="Vol">Volume</option>
                    <option value="WilliamR">William's %R</option>
                </select><br />
                <select id="Indicator4" name="Indicator4" class="input" style="width:140px;">
                    <option value="None" selected>None</option>
                    <option value="AccDist">Accumulation/Distribution</option>
                    <option value="AroonOsc">Aroon Oscillator</option>
                    <option value="Aroon">Aroon Up/Down</option>
                    <option value="ADX">Avg Directional Index</option>
                    <option value="ATR">Avg True Range</option>
                    <option value="BBW">Bollinger Band Width</option>
                    <option value="CMF">Chaikin Money Flow</option>
                    <option value="COscillator">Chaikin Oscillator</option>
                    <option value="CVolatility">Chaikin Volatility</option>
                    <option value="CLV">Close Location Value</option>
                    <option value="CCI">Commodity Channel Index</option>
                    <option value="DPO">Detrended Price Osc</option>
                    <option value="DCW">Donchian Channel Width</option>
                    <option value="EMV">Ease of Movement</option>
                    <option value="FStoch">Fast Stochastic</option>
                    <option value="MACD">MACD</option>
                    <option value="MDX">Mass Index</option>
                    <option value="Momentum">Momentum</option>
                    <option value="MFI">Money Flow Index</option>
                    <option value="NVI">Neg Volume Index</option>
                    <option value="OBV">On Balance Volume</option>
                    <option value="Performance">Performance</option>
                    <option value="PPO">% Price Oscillator</option>
                    <option value="PVO">% Volume Oscillator</option>
                    <option value="PVI">Pos Volume Index</option>
                    <option value="PVT">Price Volume Trend</option>
                    <option value="ROC">Rate of Change</option>
                    <option value="RSI">RSI</option>
                    <option value="SStoch">Slow Stochastic</option>
                    <option value="StochRSI">StochRSI</option>
                    <option value="TRIX">TRIX</option>
                    <option value="UO">Ultimate Oscillator</option>
                    <option value="Vol">Volume</option>
                    <option value="WilliamR">William's %R</option>
                </select>
            </div>
            <div class="inputtitle" style="text-align:center">
                <input id="Button1" name="Button1" type="submit" class="input" value="Update Chart">
            </div>
            </form>
        </td>
        <td>
            <div style="font:bold 20pt arial; margin:5px 0px 0px 5px">
                ChartDirector Financial Chart Demonstration
            </div>
            <hr style="border:solid 1px #000080" />
            <br />
            <img id="ChartImage" align="top" border="0">
        </td>
    </tr>
</table>
</body>
</html>
[JSP Version] jspdemo/financedemochart.jsp
<%@page import="ChartDirector.*, java.util.*" %>
<%!
//
// Create a finance chart based on user selections, which are encoded as query parameters. This code
// is designed to work with the financedemo HTML form.
//

// The timeStamps, volume, high, low, open and close data
private Date[] timeStamps = null;
double[] volData = null;
double[] highData = null;
double[] lowData = null;
double[] openData = null;
double[] closeData = null;

// An extra data series to compare with the close data
double[] compareData = null;

// The resolution of the data in seconds. 1 day = 86400 seconds.
int resolution = 86400;

/// <summary>
/// Get the timeStamps, highData, lowData, openData, closeData and volData.
/// </summary>
/// <param name="ticker">The ticker symbol for the data series.</param>
/// <param name="startDate">The starting date/time for the data series.</param>
/// <param name="endDate">The ending date/time for the data series.</param>
/// <param name="durationInDays">The number of trading days to get.</param>
/// <param name="extraPoints">The extra leading data points needed in order to
/// compute moving averages.</param>
/// <returns>True if successfully obtain the data, otherwise false.</returns>
protected boolean getData(String ticker, GregorianCalendar startDate, GregorianCalendar endDate,
    int durationInDays, int extraPoints)
{
    // This method should return false if the ticker symbol is invalid. In this sample code, as we
    // are using a random number generator for the data, all ticker symbol is allowed, but we still
    // assumed an empty symbol is invalid.
    if ("".equals(ticker)) {
        return false;
    }

    // In this demo, we can get 15 min, daily, weekly or monthly data depending on the time range.
    resolution = 86400;
    if (durationInDays <= 10) {
        // 10 days or less, we assume 15 minute data points are available
        resolution = 900;

        // We need to adjust the startDate backwards for the extraPoints. We assume 6.5 hours
        // trading time per day, and 5 trading days per week.
        double dataPointsPerDay = 6.5 * 3600 / resolution;
        GregorianCalendar adjustedStartDate = new GregorianCalendar(startDate.get(Calendar.YEAR),
            startDate.get(Calendar.MONTH), startDate.get(Calendar.DAY_OF_MONTH));
        adjustedStartDate.add(Calendar.DAY_OF_MONTH,
            -(int)Math.ceil(extraPoints / dataPointsPerDay * 7 / 5) - 2);

        // Get the required 15 min data
        get15MinData(ticker, adjustedStartDate.getTime(), endDate.getTime());

    } else if (durationInDays >= 4.5 * 360) {
        // 4 years or more - use monthly data points.
        resolution = 30 * 86400;

        // Adjust startDate backwards to cater for extraPoints
        GregorianCalendar adjustedStartDate = (GregorianCalendar)startDate.clone();
        adjustedStartDate.add(Calendar.MONTH, -extraPoints);

        // Get the required monthly data
        getMonthlyData(ticker, adjustedStartDate.getTime(), endDate.getTime());

    } else if (durationInDays >= 1.5 * 360) {
        // 1 year or more - use weekly points.
        resolution = 7 * 86400;

        // Adjust startDate backwards to cater for extraPoints
        GregorianCalendar adjustedStartDate = (GregorianCalendar)startDate.clone();
        adjustedStartDate.add(Calendar.DAY_OF_MONTH, -extraPoints * 7 - 6);

        // Get the required weekly data
        getWeeklyData(ticker, adjustedStartDate.getTime(), endDate.getTime());

    } else {
        // Default - use daily points
        resolution = 86400;

        // Adjust startDate backwards to cater for extraPoints. We multiply the days by 7/5 as we
        // assume 1 week has 5 trading days.
        GregorianCalendar adjustedStartDate = new GregorianCalendar(startDate.get(Calendar.YEAR),
            startDate.get(Calendar.MONTH), startDate.get(Calendar.DAY_OF_MONTH));
        adjustedStartDate.add(Calendar.DAY_OF_MONTH, - (extraPoints * 7 + 4) / 5 - 2);

        // Get the required daily data
        getDailyData(ticker, adjustedStartDate.getTime(), endDate.getTime());
    }

    return true;
}

/// <summary>
/// Get 15 minutes data series for timeStamps, highData, lowData, openData, closeData
/// and volData.
/// </summary>
/// <param name="ticker">The ticker symbol for the data series.</param>
/// <param name="startDate">The starting date/time for the data series.</param>
/// <param name="endDate">The ending date/time for the data series.</param>
protected void get15MinData(String ticker, Date startDate, Date endDate)
{
    //
    // In this demo, we use a random number generator to generate the data. In practice, you may get
    // the data from a database or by other means. If you do not have 15 minute data, you may modify
    // the "drawChart" method below to not using 15 minute data.
    //
    generateRandomData(ticker, startDate, endDate, 900);
}

/// <summary>
/// Get daily data series for timeStamps, highData, lowData, openData, closeData
/// and volData.
/// </summary>
/// <param name="ticker">The ticker symbol for the data series.</param>
/// <param name="startDate">The starting date/time for the data series.</param>
/// <param name="endDate">The ending date/time for the data series.</param>
protected void getDailyData(String ticker, Date startDate, Date endDate)
{
    //
    // In this demo, we use a random number generator to generate the data. In practice, you may get
    // the data from a database or by other means.
    //
    generateRandomData(ticker, startDate, endDate, 86400);
}

/// <summary>
/// Get weekly data series for timeStamps, highData, lowData, openData, closeData
/// and volData.
/// </summary>
/// <param name="ticker">The ticker symbol for the data series.</param>
/// <param name="startDate">The starting date/time for the data series.</param>
/// <param name="endDate">The ending date/time for the data series.</param>
protected void getWeeklyData(String ticker, Date startDate, Date endDate)
{
    //
    // If you do not have weekly data, you may call "getDailyData(startDate, endDate)" to get daily
    // data, then call "convertDailyToWeeklyData()" to convert to weekly data.
    //
    generateRandomData(ticker, startDate, endDate, 86400 * 7);
}

/// <summary>
/// Get monthly data series for timeStamps, highData, lowData, openData, closeData
/// and volData.
/// </summary>
/// <param name="ticker">The ticker symbol for the data series.</param>
/// <param name="startDate">The starting date/time for the data series.</param>
/// <param name="endDate">The ending date/time for the data series.</param>
protected void getMonthlyData(String ticker, Date startDate, Date endDate)
{
    //
    // If you do not have weekly data, you may call "getDailyData(startDate, endDate)" to get daily
    // data, then call "convertDailyToMonthlyData()" to convert to monthly data.
    //
    generateRandomData(ticker, startDate, endDate, 86400 * 30);
}

/// <summary>
/// A random number generator designed to generate realistic financial data.
/// </summary>
/// <param name="ticker">The ticker symbol for the data series.</param>
/// <param name="startDate">The starting date/time for the data series.</param>
/// <param name="endDate">The ending date/time for the data series.</param>
/// <param name="resolution">The period of the data series.</param>
protected void generateRandomData(String ticker, Date startDate, Date endDate, int resolution)
{
    FinanceSimulator db = new FinanceSimulator(ticker, startDate, endDate, resolution);
    timeStamps = db.getTimeStamps();
    highData = db.getHighData();
    lowData = db.getLowData();
    openData = db.getOpenData();
    closeData = db.getCloseData();
    volData = db.getVolData();
}

/// <summary>
/// A utility to convert daily to weekly data.
/// </summary>
protected void convertDailyToWeeklyData()
{
    aggregateData(new ArrayMath(timeStamps).selectStartOfWeek());
}

/// <summary>
/// A utility to convert daily to monthly data.
/// </summary>
protected void convertDailyToMonthlyData()
{
    aggregateData(new ArrayMath(timeStamps).selectStartOfMonth());
}

/// <summary>
/// An internal method used to aggregate daily data.
/// </summary>
protected void aggregateData(ArrayMath aggregator)
{
    timeStamps = Chart.NTime(aggregator.aggregate(Chart.CTime(timeStamps), Chart.AggregateFirst));
    highData = aggregator.aggregate(highData, Chart.AggregateMax);
    lowData = aggregator.aggregate(lowData, Chart.AggregateMin);
    openData = aggregator.aggregate(openData, Chart.AggregateFirst);
    closeData = aggregator.aggregate(closeData, Chart.AggregateLast);
    volData = aggregator.aggregate(volData, Chart.AggregateSum);
}

/// <summary>
/// Create a financial chart according to user selections. The user selections are
/// encoded in the query parameters.
/// </summary>
public BaseChart drawChart(HttpServletRequest request)
{
    // In this demo, we just assume we plot up to the latest time. So end date is now.
    GregorianCalendar endDate = new GregorianCalendar();

    // If the trading day has not yet started (before 9:30am), or if the end date is on on Sat or
    // Sun, we set the end date to 4:00pm of the last trading day
    while ((endDate.get(Calendar.HOUR_OF_DAY) * 60 + endDate.get(Calendar.MINUTE) <
        9 * 60 + 30) || (endDate.get(Calendar.DAY_OF_WEEK) == Calendar.SUNDAY) ||
        (endDate.get(Calendar.DAY_OF_WEEK) == Calendar.SATURDAY))
    {
        endDate.add(Calendar.DAY_OF_MONTH, -1);
        endDate.set(Calendar.HOUR_OF_DAY, 16);
        endDate.set(Calendar.MINUTE, 0);
        endDate.set(Calendar.SECOND, 0);
    }

    // The duration selected by the user
    int durationInDays = Integer.parseInt(request.getParameter("TimeRange"));

    // Compute the start date by subtracting the duration from the end date.
    GregorianCalendar startDate;
    if (durationInDays >= 30) {
        // More or equal to 30 days - so we use months as the unit
        startDate = new GregorianCalendar(endDate.get(Calendar.YEAR),
            endDate.get(Calendar.MONTH), 1);
        startDate.add(Calendar.MONTH, -durationInDays / 30);
    } else {
        // Less than 30 days - use day as the unit. The starting point of the axis is always at the
        // start of the day (9:30am). Note that we use trading days, so we skip Sat and Sun in
        // counting the days.
        startDate = new GregorianCalendar(endDate.get(Calendar.YEAR),
            endDate.get(Calendar.MONTH), endDate.get(Calendar.DAY_OF_MONTH), 9, 30, 0);
        for (int i = 1; i < durationInDays; ++i)
        {
            startDate.add(Calendar.DAY_OF_MONTH,
                (startDate.get(Calendar.DAY_OF_WEEK) == Calendar.MONDAY) ? -3 : -1);
        }
    }

    // The moving average periods selected by the user.
    int avgPeriod1 = 0;
    try { avgPeriod1 = Integer.parseInt(request.getParameter("movAvg1")); }
    catch (Exception e) { avgPeriod1 = 0; }
    int avgPeriod2 = 0;
    try { avgPeriod2 = Integer.parseInt(request.getParameter("movAvg2")); }
    catch (Exception e) { avgPeriod2 = 0; }

    if (avgPeriod1 < 0) {
        avgPeriod1 = 0;
    } else if (avgPeriod1 > 300) {
        avgPeriod1 = 300;
    }

    if (avgPeriod2 < 0) {
        avgPeriod2 = 0;
    } else if (avgPeriod2 > 300) {
        avgPeriod2 = 300;
    }

    // We need extra leading data points in order to compute moving averages.
    int extraPoints = 20;
    if (avgPeriod1 > extraPoints) {
        extraPoints = avgPeriod1;
    }
    if (avgPeriod2 > extraPoints) {
        extraPoints = avgPeriod2;
    }

    // Get the data series to compare with, if any.
    String compareKey = request.getParameter("CompareWith").trim();
    compareData = null;
    if (getData(compareKey, startDate, endDate, durationInDays, extraPoints)) {
          compareData = closeData;
    }

    // The data series we want to get.
    String tickerKey = request.getParameter("TickerSymbol").trim();
    if (!getData(tickerKey, startDate, endDate, durationInDays, extraPoints)) {
        return errMsg("Please enter a valid ticker symbol");
    }

    // We now confirm the actual number of extra points (data points that are before the start date)
    // as inferred using actual data from the database.
    extraPoints = timeStamps.length;
    Date cutOff = startDate.getTime();
    for (int i = 0; i < timeStamps.length; ++i)
    {
        if (!timeStamps[i].before(cutOff))
        {
            extraPoints = i;
            break;
        }
    }

    // Check if there is any valid data
    if (extraPoints >= timeStamps.length) {
        // No data - just display the no data message.
        return errMsg("No data available for the specified time period");
    }

    // In some finance chart presentation style, even if the data for the latest day is not fully
    // available, the axis for the entire day will still be drawn, where no data will appear near
    // the end of the axis.
    if (resolution < 86400) {
        // Add extra points to the axis until it reaches the end of the day. The end of day is
        // assumed to be 16:00 (it depends on the stock exchange).
        GregorianCalendar lastTime = new GregorianCalendar();
        lastTime.setTime(timeStamps[timeStamps.length - 1]);
        int extraTrailingPoints = (int)((16 * 3600 - lastTime.get(Calendar.HOUR_OF_DAY) * 3600
            - lastTime.get(Calendar.MINUTE) * 60 - lastTime.get(Calendar.SECOND)) / resolution);
        if (extraTrailingPoints > 0)
        {
            Date[] extendedTimeStamps = new Date[timeStamps.length + extraTrailingPoints];
            System.arraycopy(timeStamps, 0, extendedTimeStamps, 0, timeStamps.length);
            for (int i = 0; i < extraTrailingPoints; ++i)
            {
                lastTime.add(Calendar.SECOND, resolution);
                extendedTimeStamps[i + timeStamps.length] = (Date)lastTime.getTime().clone();
            }
            timeStamps = extendedTimeStamps;
        }
    }

    //
    // At this stage, all data are available. We can draw the chart as according to user input.
    //

    //
    // Determine the chart size. In this demo, user can select 4 different chart sizes. Default is
    // the large chart size.
    //
    int width = 780;
    int mainHeight = 255;
    int indicatorHeight = 80;

    String size = request.getParameter("ChartSize");
    if ("S".equals(size)) {
        // Small chart size
        width = 450;
        mainHeight = 160;
        indicatorHeight = 60;
    } else if ("M".equals(size)) {
        // Medium chart size
        width = 620;
        mainHeight = 215;
        indicatorHeight = 70;
    } else if ("H".equals(size)) {
        // Huge chart size
        width = 1000;
        mainHeight = 320;
        indicatorHeight = 90;
    }

    // Create the chart object using the selected size
    FinanceChart m = new FinanceChart(width);

    // Set the data into the chart object
    m.setData(timeStamps, highData, lowData, openData, closeData, volData, extraPoints);

    //
    // We configure the title of the chart. In this demo chart design, we put the company name as
    // the top line of the title with left alignment.
    //
    m.addPlotAreaTitle(Chart.TopLeft, tickerKey);

    // We displays the current date as well as the data resolution on the next line.
    String resolutionText = "";
    if (resolution == 30 * 86400) {
        resolutionText = "Monthly";
    } else if (resolution == 7 * 86400) {
        resolutionText = "Weekly";
    } else if (resolution == 86400) {
        resolutionText = "Daily";
    } else if (resolution == 900) {
        resolutionText = "15-min";
    }

    m.addPlotAreaTitle(Chart.BottomLeft, "<*font=Arial,size=8*>" + m.formatValue(new Date(),
        "mmm dd, yyyy") + " - " + resolutionText + " chart");

    // A copyright message at the bottom left corner the title area
    m.addPlotAreaTitle(Chart.BottomRight, "<*font=Arial,size=8*>(c) Advanced Software Engineering");

    //
    // Add the first techical indicator according. In this demo, we draw the first indicator on top
    // of the main chart.
    //
    addIndicator(m, request.getParameter("Indicator1"), indicatorHeight);

    //
    // Add the main chart
    //
    m.addMainChart(mainHeight);

    //
    // Set log or linear scale according to user preference
    //
    if ("1".equals(request.getParameter("LogScale"))) {
        m.setLogScale(true);
    }

    //
    // Set axis labels to show data values or percentage change to user preference
    //
    if ("1".equals(request.getParameter("PercentageScale"))) {
        m.setPercentageAxis();
    }

    //
    // Draw any price line the user has selected
    //
    String mainType = request.getParameter("ChartType");
    if ("Close".equals(mainType)) {
        m.addCloseLine(0x000040);
    } else if ("TP".equals(mainType)) {
        m.addTypicalPrice(0x000040);
    } else if ("WC".equals(mainType)) {
        m.addWeightedClose(0x000040);
    } else if ("Median".equals(mainType)) {
        m.addMedianPrice(0x000040);
    }

    //
    // Add comparison line if there is data for comparison
    //
    if (compareData != null) {
        if (compareData.length > extraPoints) {
            m.addComparison(compareData, 0x0000ff, compareKey);
        }
    }

    //
    // Add moving average lines.
    //
    addMovingAvg(m, request.getParameter("avgType1"), avgPeriod1, 0x663300);
    addMovingAvg(m, request.getParameter("avgType2"), avgPeriod2, 0x9900ff);

    //
    // Draw candlesticks or OHLC symbols if the user has selected them.
    //
    if ("CandleStick".equals(mainType)) {
        m.addCandleStick(0x33ff33, 0xff3333);
    } else if ("OHLC".equals(mainType)) {
        m.addHLOC(0x008800, 0xcc0000);
    }

    //
    // Add parabolic SAR if necessary
    //
    if ("1".equals(request.getParameter("ParabolicSAR"))) {
        m.addParabolicSAR(0.02, 0.02, 0.2, Chart.DiamondShape, 5, 0x008800, 0x000000);
    }

    //
    // Add price band/channel/envelop to the chart according to user selection
    //
    String bandType = request.getParameter("Band");
    if ("BB".equals(bandType)) {
        m.addBollingerBand(20, 2, 0x9999ff, 0xc06666ff);
    } else if ("DC".equals(bandType)) {
        m.addDonchianChannel(20, 0x9999ff, 0xc06666ff);
    } else if ("Envelop".equals(bandType)) {
        m.addEnvelop(20, 0.1, 0x9999ff, 0xc06666ff);
    }

    //
    // Add volume bars to the main chart if necessary
    //
    if ("1".equals(request.getParameter("Volume"))) {
        m.addVolBars(indicatorHeight, 0x99ff99, 0xff9999, 0xc0c0c0);
    }

    //
    // Add additional indicators as according to user selection.
    //
    addIndicator(m, request.getParameter("Indicator2"), indicatorHeight);
    addIndicator(m, request.getParameter("Indicator3"), indicatorHeight);
    addIndicator(m, request.getParameter("Indicator4"), indicatorHeight);

    return m;
}

/// <summary>
/// Add a moving average line to the FinanceChart object.
/// </summary>
/// <param name="m">The FinanceChart object to add the line to.</param>
/// <param name="avgType">The moving average type (SMA/EMA/TMA/WMA).</param>
/// <param name="avgPeriod">The moving average period.</param>
/// <param name="color">The color of the line.</param>
/// <returns>The LineLayer object representing line layer created.</returns>
protected LineLayer addMovingAvg(FinanceChart m, String avgType, int avgPeriod, int color)
{
    if (avgPeriod > 1) {
        if ("SMA".equals(avgType)) {
            return m.addSimpleMovingAvg(avgPeriod, color);
        } else if ("EMA".equals(avgType)) {
            return m.addExpMovingAvg(avgPeriod, color);
        } else if ("TMA".equals(avgType)) {
            return m.addTriMovingAvg(avgPeriod, color);
        } else if ("WMA".equals(avgType)) {
            return m.addWeightedMovingAvg(avgPeriod, color);
        }
    }
    return null;
}

/// <summary>
/// Add an indicator chart to the FinanceChart object. In this demo example, the
/// indicator parameters (such as the period used to compute RSI, colors of the lines,
/// etc.) are hard coded to commonly used values. You are welcome to design a more
/// complex user interface to allow users to set the parameters.
/// </summary>
/// <param name="m">The FinanceChart object to add the line to.</param>
/// <param name="indicator">The selected indicator.</param>
/// <param name="height">Height of the chart in pixels</param>
/// <returns>The XYChart object representing indicator chart.</returns>
protected XYChart addIndicator(FinanceChart m, String indicator, int height)
{
    if ("RSI".equals(indicator)) {
        return m.addRSI(height, 14, 0x800080, 20, 0xff6666, 0x6666ff);
    } else if ("StochRSI".equals(indicator)) {
        return m.addStochRSI(height, 14, 0x800080, 30, 0xff6666, 0x6666ff);
    } else if ("MACD".equals(indicator)) {
        return m.addMACD(height, 26, 12, 9, 0x0000ff, 0xff00ff, 0x008000);
    } else if ("FStoch".equals(indicator)) {
        return m.addFastStochastic(height, 14, 3, 0x006060, 0x606000);
    } else if ("SStoch".equals(indicator)) {
        return m.addSlowStochastic(height, 14, 3, 0x006060, 0x606000);
    } else if ("ATR".equals(indicator)) {
        return m.addATR(height, 14, 0x808080, 0x0000ff);
    } else if ("ADX".equals(indicator)) {
        return m.addADX(height, 14, 0x008000, 0x800000, 0x000080);
    } else if ("DCW".equals(indicator)) {
        return m.addDonchianWidth(height, 20, 0x0000ff);
    } else if ("BBW".equals(indicator)) {
        return m.addBollingerWidth(height, 20, 2, 0x0000ff);
    } else if ("DPO".equals(indicator)) {
        return m.addDPO(height, 20, 0x0000ff);
    } else if ("PVT".equals(indicator)) {
        return m.addPVT(height, 0x0000ff);
    } else if ("Momentum".equals(indicator)) {
        return m.addMomentum(height, 12, 0x0000ff);
    } else if ("Performance".equals(indicator)) {
        return m.addPerformance(height, 0x0000ff);
    } else if ("ROC".equals(indicator)) {
        return m.addROC(height, 12, 0x0000ff);
    } else if ("OBV".equals(indicator)) {
        return m.addOBV(height, 0x0000ff);
    } else if ("AccDist".equals(indicator)) {
        return m.addAccDist(height, 0x0000ff);
    } else if ("CLV".equals(indicator)) {
        return m.addCLV(height, 0x0000ff);
    } else if ("WilliamR".equals(indicator)) {
        return m.addWilliamR(height, 14, 0x800080, 30, 0xff6666, 0x6666ff);
    } else if ("Aroon".equals(indicator)) {
        return m.addAroon(height, 14, 0x339933, 0x333399);
    } else if ("AroonOsc".equals(indicator)) {
        return m.addAroonOsc(height, 14, 0x0000ff);
    } else if ("CCI".equals(indicator)) {
        return m.addCCI(height, 20, 0x800080, 100, 0xff6666, 0x6666ff);
    } else if ("EMV".equals(indicator)) {
        return m.addEaseOfMovement(height, 9, 0x006060, 0x606000);
    } else if ("MDX".equals(indicator)) {
        return m.addMassIndex(height, 0x800080, 0xff6666, 0x6666ff);
    } else if ("CVolatility".equals(indicator)) {
        return m.addChaikinVolatility(height, 10, 10, 0x0000ff);
    } else if ("COscillator".equals(indicator)) {
        return m.addChaikinOscillator(height, 0x0000ff);
    } else if ("CMF".equals(indicator)) {
        return m.addChaikinMoneyFlow(height, 21, 0x008000);
    } else if ("NVI".equals(indicator)) {
        return m.addNVI(height, 255, 0x0000ff, 0x883333);
    } else if ("PVI".equals(indicator)) {
        return m.addPVI(height, 255, 0x0000ff, 0x883333);
    } else if ("MFI".equals(indicator)) {
        return m.addMFI(height, 14, 0x800080, 30, 0xff6666, 0x6666ff);
    } else if ("PVO".equals(indicator)) {
        return m.addPVO(height, 26, 12, 9, 0x0000ff, 0xff00ff, 0x008000);
    } else if ("PPO".equals(indicator)) {
        return m.addPPO(height, 26, 12, 9, 0x0000ff, 0xff00ff, 0x008000);
    } else if ("UO".equals(indicator)) {
        return m.addUltimateOscillator(height, 7, 14, 28, 0x800080, 20, 0xff6666, 0x6666ff);
    } else if ("Vol".equals(indicator)) {
        return m.addVolIndicator(height, 0x99ff99, 0xff9999, 0xc0c0c0);
    } else if ("TRIX".equals(indicator)) {
        return m.addTRIX(height, 12, 0x0000ff);
    }
    return null;
}

/// <summary>
/// Creates a dummy chart to show an error message.
/// </summary>
/// <param name="msg">The error message.
/// <returns>The BaseChart object containing the error message.</returns>
protected BaseChart errMsg(String msg)
{
    MultiChart m = new MultiChart(400, 200);
    m.addTitle2(Chart.Center, msg, "Arial", 10).setMaxWidth(m.getWidth());
    return m;
}
%>
<%

// Create the finance chart
BaseChart c = drawChart(request);


// Stream chart to the browser
WebChartViewer viewer = new WebChartViewer(request, "chart1");
viewer.setChart(c, Chart.SVG);
if (viewer.streamChart(response))
    return;

%>
© 2021 Advanced Software Engineering Limited. All rights reserved.