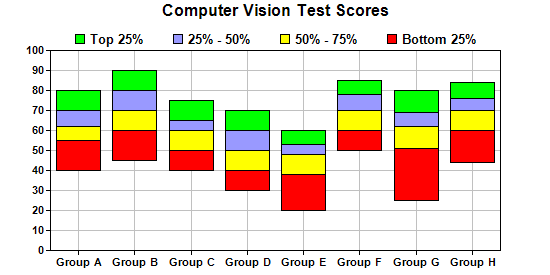
This example demonstrates creating a multi-color floating box chart.
This chart is composed of 4 box-whisker layers, created using
XYChart.addBoxWhiskerLayer. Each layer handles boxes of one color. Only the "box" part of the box-whisker layer is used.
[JSP Version] jspdemo/floatingbox.jsp
<%@page import="ChartDirector.*, java.util.*" %>
<%
// Sample data for the Box-Whisker chart. Represents the minimum, 1st quartile, medium, 3rd quartile
// and maximum values of some quantities
double[] Q0Data = {40, 45, 40, 30, 20, 50, 25, 44};
double[] Q1Data = {55, 60, 50, 40, 38, 60, 51, 60};
double[] Q2Data = {62, 70, 60, 50, 48, 70, 62, 70};
double[] Q3Data = {70, 80, 65, 60, 53, 78, 69, 76};
double[] Q4Data = {80, 90, 75, 70, 60, 85, 80, 84};

// The labels for the chart
String[] labels = {"Group A", "Group B", "Group C", "Group D", "Group E", "Group F", "Group G",
    "Group H"};

// Create a XYChart object of size 550 x 250 pixels
XYChart c = new XYChart(550, 275);

// Set the plotarea at (50, 25) and of size 450 x 200 pixels. Enable both horizontal and vertical
// grids by setting their colors to grey (0xc0c0c0)
c.setPlotArea(50, 50, 450, 200).setGridColor(0xc0c0c0, 0xc0c0c0);

// Add a title to the chart
c.addTitle("Computer Vision Test Scores");

// Set the labels on the x axis and the font to Arial Bold
c.xAxis().setLabels(labels).setFontStyle("Arial Bold");

// Set the font for the y axis labels to Arial Bold
c.yAxis().setLabelStyle("Arial Bold");

// Add a Box Whisker layer using light blue 0x9999ff as the fill color and blue (0xcc) as the line
// color. Set the line width to 2 pixels
c.addBoxLayer(Q4Data, Q3Data, 0x00ff00, "Top 25%");
c.addBoxLayer(Q3Data, Q2Data, 0x9999ff, "25% - 50%");
c.addBoxLayer(Q2Data, Q1Data, 0xffff00, "50% - 75%");
c.addBoxLayer(Q1Data, Q0Data, 0xff0000, "Bottom 25%");

// Add legend box at top center above the plot area using 10pt Arial Bold Font
LegendBox b = c.addLegend(50 + 225, 22, false, "Arial Bold", 10);
b.setAlignment(Chart.TopCenter);
b.setBackground(Chart.Transparent);

// Output the chart
WebChartViewer viewer = new WebChartViewer(request, "chart1");
viewer.setChart(c, Chart.SVG);

// Include tool tip for the chart
viewer.setImageMap(c.getHTMLImageMap("", "",
    "title='{xLabel} ({dataSetName}): {bottom} to {top} points'"));
%>
<!DOCTYPE html>
<html>
<head>
    <title>Floating Box Chart</title>
    <!-- Include ChartDirector Javascript Library to support chart interactions -->
    <script type="text/javascript" src="cdjcv.js"></script>
</head>
<body style="margin:5px 0px 0px 5px">
    <div style="font:bold 18pt verdana;">
        Floating Box Chart
    </div>
    <hr style="border:solid 1px #000080; background:#000080" />
    <div style="font:10pt verdana; margin-bottom:1.5em">
        <a href="viewsource.jsp?file=<%=request.getServletPath()%>">View Source Code</a>
    </div>
    <!-- ****** Here is the chart image ****** -->
    <%= viewer.renderHTML(response) %>
</body>
</html>
© 2021 Advanced Software Engineering Limited. All rights reserved.