This example extends the
Icon Pie Chart (1) example to demonstrate using
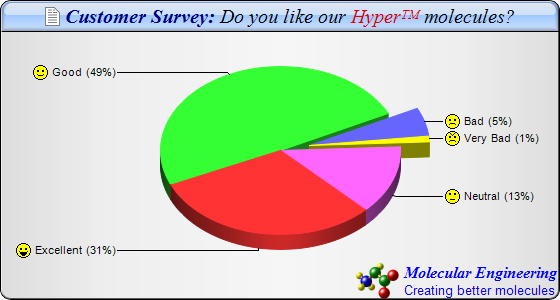
CDML to include multiple fonts and colors in chart title, sector labels and to draw logo. It also demonstrates silver background color, rounded corners, and glass shading effect for title.
[JSP Version] jspdemo/iconpie2.jsp
<%@page import="ChartDirector.*, java.util.*" %>
<%
// The data for the pie chart
double[] data = {28, 45, 5, 1, 12};

// The labels for the pie chart
String[] labels = {"Excellent", "Good", "Bad", "Very Bad", "Neutral"};

// The icons for the sectors
String[] icons = {"laugh.png", "smile.png", "sad.png", "angry.png", "nocomment.png"};

// Create a PieChart object of size 560 x 300 pixels, with a silver background, black border, 1
// pxiel 3D border effect and rounded corners
PieChart c = new PieChart(560, 300, Chart.silverColor(), 0x000000, 1);
c.setRoundedFrame();

//Set search path to current JSP directory for loading icon images
c.setSearchPath(getServletConfig().getServletContext(), request);

// Set the center of the pie at (280, 150) and the radius to 120 pixels
c.setPieSize(280, 150, 120);

// Add a title box with title written in CDML, on a sky blue (A0C8FF) background with glass effect
c.addTitle(
    "<*block,valign=absmiddle*><*img=doc.png*> Customer Survey: <*font=Times New Roman " +
    "Italic,color=000000*>Do you like our <*font,color=dd0000*>Hyper<*super*>TM<*/font*> " +
    "molecules?", "Times New Roman Bold Italic", 15, 0x000080).setBackground(0xa0c8ff, 0x000000,
    Chart.glassEffect());

// Add a logo to the chart written in CDML as the bottom title aligned to the bottom right
c.addTitle2(Chart.BottomRight,
    "<*block,valign=absmiddle*><*img=molecule.png*> <*block*><*color=FF*><*font=Times New Roman " +
    "Bold Italic,size=12*>Molecular Engineering\n<*font=Arial,size=10*>Creating better molecules");

// Set the pie data and the pie labels
c.setData(data, labels);

// Set 3D style
c.set3D();

// Use the side label layout method
c.setLabelLayout(Chart.SideLayout);

// Set the label background color to transparent
c.setLabelStyle().setBackground(Chart.Transparent);

// Add icons to the chart as a custom field
c.addExtraField(icons);

// Configure the sector labels using CDML to include the icon images
c.setLabelFormat("<*block,valign=absmiddle*><*img={field0}*> {label} ({percent|0}%)");

// Explode the 3rd and 4th sectors as a group (index = 2 and 3)
c.setExplodeGroup(2, 3);

// Set the start angle to 135 degrees may improve layout when there are many small sectors at the
// end of the data array (that is, data sorted in descending order). It is because this makes the
// small sectors position near the horizontal axis, where the text label has the least tendency to
// overlap. For data sorted in ascending order, a start angle of 45 degrees can be used instead.
c.setStartAngle(135);

// Output the chart
WebChartViewer viewer = new WebChartViewer(request, "chart1");
viewer.setChart(c, Chart.SVG);

// Include tool tip for the chart
viewer.setImageMap(c.getHTMLImageMap("", "", "title='{label}: {value} responses ({percent}%)'"));
%>
<!DOCTYPE html>
<html>
<head>
    <title>Icon Pie Chart (2)</title>
    <!-- Include ChartDirector Javascript Library to support chart interactions -->
    <script type="text/javascript" src="cdjcv.js"></script>
</head>
<body style="margin:5px 0px 0px 5px">
    <div style="font:bold 18pt verdana;">
        Icon Pie Chart (2)
    </div>
    <hr style="border:solid 1px #000080; background:#000080" />
    <div style="font:10pt verdana; margin-bottom:1.5em">
        <a href="viewsource.jsp?file=<%=request.getServletPath()%>">View Source Code</a>
    </div>
    <!-- ****** Here is the chart image ****** -->
    <%= viewer.renderHTML(response) %>
</body>
</html>
© 2021 Advanced Software Engineering Limited. All rights reserved.