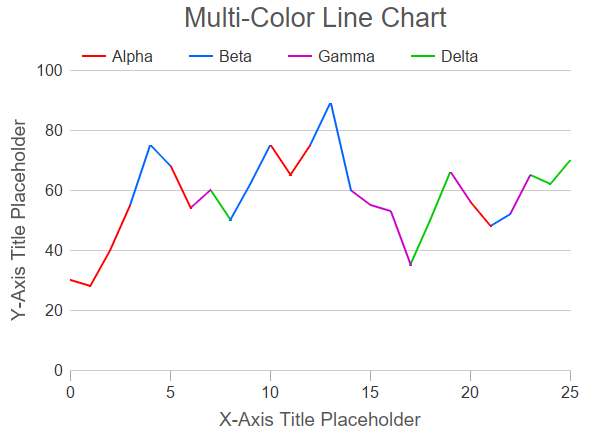
This example demonstrates a line chart with line segments of different colors.
In this example, each line segment has a type specified in the pointType array. Note that with N data points, there will only be (N - 1) line segments. So the pointType array size is one less than the data point array size.
A loop is used to separate the line segments by type into different line layers, The line layers are configured with different colors and names. This generates the multi-color line and the legend entries.
[JSP Version] jspdemo/multicolorline.jsp
<%@page import="ChartDirector.*, java.util.*" %>
<%
// Data points for the line chart
double[] dataX = {0, 1, 2, 3, 4, 5, 6, 7, 8, 9, 10, 11, 12, 13, 14, 15, 16, 17, 18, 19, 20, 21, 22,
    23, 24, 25};
double[] dataY = {30, 28, 40, 55, 75, 68, 54, 60, 50, 62, 75, 65, 75, 89, 60, 55, 53, 35, 50, 66,
    56, 48, 52, 65, 62, 70};

// The data point type. The color of the line segment will be based on the starting point type of
// the segment. In this example, we have 4 point types for 4 different colors. Note that for a line
// with N points, there will be (N - 1) line segments, so we only need (N - 1) values in the point
// type array.
int[] pointType = {0, 0, 0, 1, 1, 0, 2, 3, 1, 1, 0, 0, 1, 1, 2, 2, 2, 3, 3, 2, 0, 1, 2, 3, 3};
int[] colors = {0xff0000, 0x0066ff, 0xcc00cc, 0x00cc00};
String[] pointTypeLabels = {"Alpha", "Beta", "Gamma", "Delta"};

// Create a XYChart object of size 600 x 430 pixels
XYChart c = new XYChart(600, 430);

// Set default text color to dark grey (0x333333)
c.setColor(Chart.TextColor, 0x333333);

// Add a title box using grey (0x555555) 20pt Arial font
c.addTitle("    Multi-Color Line Chart", "Arial", 20, 0x555555);

// Set the plotarea at (70, 70) and of size 500 x 300 pixels, with transparent background and border
// and light grey (0xcccccc) horizontal grid lines
c.setPlotArea(70, 70, 500, 300, Chart.Transparent, -1, Chart.Transparent, 0xcccccc);

// Add a legend box with horizontal layout above the plot area at (70, 35). Use 12pt Arial font,
// transparent background and border, and line style legend icon.
LegendBox b = c.addLegend(70, 35, false, "Arial", 12);
b.setBackground(Chart.Transparent, Chart.Transparent);
b.setLineStyleKey();

// Set axis label font to 12pt Arial
c.xAxis().setLabelStyle("Arial", 12);
c.yAxis().setLabelStyle("Arial", 12);

// Set the x and y axis stems to transparent, and the x-axis tick color to grey (0xaaaaaa)
c.xAxis().setColors(Chart.Transparent, Chart.TextColor, Chart.TextColor, 0xaaaaaa);
c.yAxis().setColors(Chart.Transparent);

// Set the major/minor tick lengths for the x-axis to 10 and 0.
c.xAxis().setTickLength(10, 0);

// For the automatic axis labels, set the minimum spacing to 80/40 pixels for the x/y axis.
c.xAxis().setTickDensity(80);
c.yAxis().setTickDensity(40);

// Add a title to the y axis using dark grey (0x555555) 14pt Arial font
c.xAxis().setTitle("X-Axis Title Placeholder", "Arial", 14, 0x555555);
c.yAxis().setTitle("Y-Axis Title Placeholder", "Arial", 14, 0x555555);

// In ChartDirector, each line layer can only have one line color, so we use 4 line layers to draw
// the 4 different colors of line segments.

// In general, the line segments for each color will not be continuous. In ChartDirector,
// non-continuous line segments can be achieved by inserting NoValue points. To allow for these
// extra points, we use a buffer twice the size of the original data arrays.
double[] lineX = new double[dataX.length * 2];
double[] lineY = new double[dataY.length * 2];

// Use a loop to create a line layer for each color
for(int i = 0; i < colors.length; ++i) {
    int n = 0;
    for(int j = 0; j < dataX.length; ++j) {
        // We include data points of the target type in the line layer.
        if ((j < pointType.length) && (pointType[j] == i)) {
            lineX[n] = dataX[j];
            lineY[n] = dataY[j];
            n = n + 1;
        } else if ((j > 0) && (pointType[j - 1] == i)) {
            // If the current point is not of the target, but the previous point is of the target
            // type, we still need to include the current point in the line layer, as it takes two
            // points to draw a line segment. We also need an extra NoValue point so that the
            // current point will not join with the next point.
            lineX[n] = dataX[j];
            lineY[n] = dataY[j];
            n = n + 1;
            lineX[n] = dataX[j];
            lineY[n] = Chart.NoValue;
            n = n + 1;
        }
    }
    // Draw the layer that contains all segments of the target color
    LineLayer layer = c.addLineLayer(Arrays.copyOfRange(lineY, 0, n), colors[i], pointTypeLabels[i])
        ;
    layer.setXData(Arrays.copyOfRange(lineX, 0, n));
    layer.setLineWidth(2);
}

// Output the chart
WebChartViewer viewer = new WebChartViewer(request, "chart1");
viewer.setChart(c, Chart.SVG);
%>
<!DOCTYPE html>
<html>
<head>
    <title>Multi-Color Line Chart</title>
    <!-- Include ChartDirector Javascript Library to support chart interactions -->
    <script type="text/javascript" src="cdjcv.js"></script>
</head>
<body style="margin:5px 0px 0px 5px">
    <div style="font:bold 18pt verdana;">
        Multi-Color Line Chart
    </div>
    <hr style="border:solid 1px #000080; background:#000080" />
    <div style="font:10pt verdana; margin-bottom:1.5em">
        <a href="viewsource.jsp?file=<%=request.getServletPath()%>">View Source Code</a>
    </div>
    <!-- ****** Here is the chart image ****** -->
    <%= viewer.renderHTML(response) %>
</body>
</html>
© 2021 Advanced Software Engineering Limited. All rights reserved.