The example demonstrates various tree map layout methods for multi-level tree maps.
In ChartDirector, each node in a tree map can be configured to use a different layout method for its child nodes using
TreeMapNode.setLayoutMethod. The The prototype node, available via
TreeMapChart.getLevelPrototype, can also be used to set a default layout method for nodes a certain level.
[JSP Version] jspdemo/multileveltreemaplayout.jsp
<%@page import="ChartDirector.*, java.util.*" %>
<%!
// Function to create the demo charts
void createChart(WebChartViewer viewer, int chartIndex)
{
// The first level nodes of the tree map. There are 4 nodes.
String[] names = {"A", "B", "C", "D"};
// Use random numbers for second level nodes
RanSeries r = new RanSeries(11 + chartIndex);
double[] series0 = r.getSeries(6, 10, 100);
double[] series1 = r.getSeries(6, 10, 100);
double[] series2 = r.getSeries(6, 10, 100);
double[] series3 = r.getSeries(6, 10, 100);
// Colors for second level nodes
int[] colors0 = {0xddeedd, 0xbbeebb, 0x99ee99, 0x77ee77, 0x55ee55, 0x33ee33};
int[] colors1 = {0xffeedd, 0xffddbb, 0xffcc99, 0xffbb77, 0xffaa55, 0xff9933};
int[] colors2 = {0xddeeff, 0xbbddff, 0x99ccee, 0x77bbee, 0x55aadd, 0x3399dd};
int[] colors3 = {0xffeeff, 0xeeccee, 0xddaadd, 0xcc88cc, 0xbb66bb, 0xaa44aa};
// Create a Tree Map object of size 400 x 380 pixels
TreeMapChart c = new TreeMapChart(400, 380);
// Set the plotarea at (10, 35) and of size 380 x 300 pixels
c.setPlotArea(10, 35, 380, 300);
// Obtain the root of the tree map, which is the entire plot area
TreeMapNode root = c.getRootNode();
// Add first level nodes to the root. We do not need to provide data as they will be computed as
// the sum of the second level nodes.
root.setData(null, names);
// Add second level nodes to each of the first level node
root.getNode(0).setData(series0, null, colors0);
root.getNode(1).setData(series1, null, colors1);
root.getNode(2).setData(series2, null, colors2);
root.getNode(3).setData(series3, null, colors2);
// Get the prototype (template) for the first level nodes.
TreeMapNode nodeConfig = c.getLevelPrototype(1);
// Hide the first level node cell border by setting its color to transparent
nodeConfig.setColors(-1, Chart.Transparent);
// Get the prototype (template) for the second level nodes.
TreeMapNode nodeConfig2 = c.getLevelPrototype(2);
// Set the label format for the nodes to include the parent node's label and index of the second
// level node. Use semi-transparent black (3f000000) Arial Bold font and put the label at the
// center of the cell.
nodeConfig2.setLabelFormat("{parent.label}{index}", "Arial Bold", 8, 0x3f000000, Chart.Center);
// Set the second level node cell border to white (ffffff)
nodeConfig2.setColors(-1, 0xffffff);
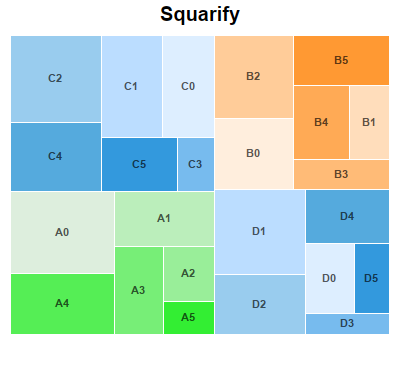
if (chartIndex == 0) {
// Squarify (default) - Layout the cells so that they are as square as possible.
c.addTitle("Squarify", "Arial Bold", 15);
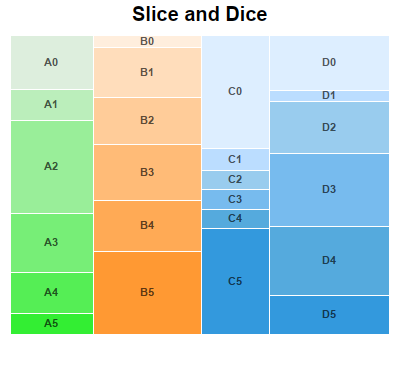
} else if (chartIndex == 1) {
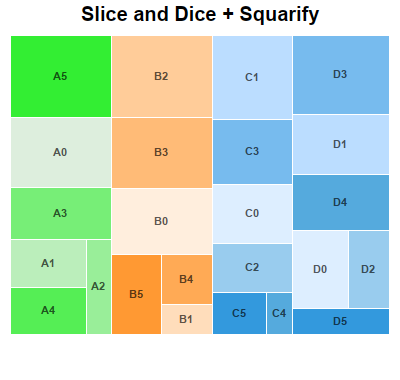
// Slice and Dice - First level cells flow horizontally. Second level cells flow vertically.
// (The setLayoutMethod also supports other flow directions.)
c.addTitle("Slice and Dice", "Arial Bold", 15);
root.setLayoutMethod(Chart.TreeMapSliceAndDice);
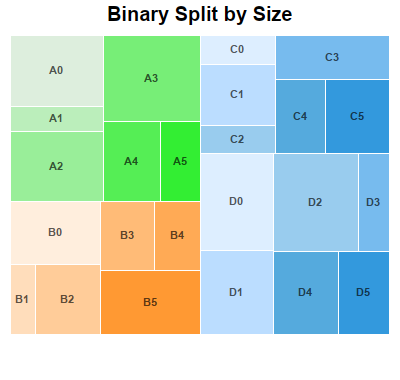
} else if (chartIndex == 2) {
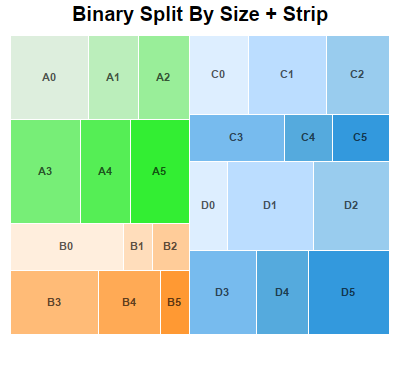
// Binary Split by Size - Split the cells into left/right groups so that their size are as
// close as possible. For each group, split the cells into top/bottom groups using the same
// criteria. Continue until each group contains one cell. (The setLayoutMethod also supports
// other flow directions.)
c.addTitle("Binary Split by Size", "Arial Bold", 15);
root.setLayoutMethod(Chart.TreeMapBinaryBySize);
nodeConfig.setLayoutMethod(Chart.TreeMapBinaryBySize);
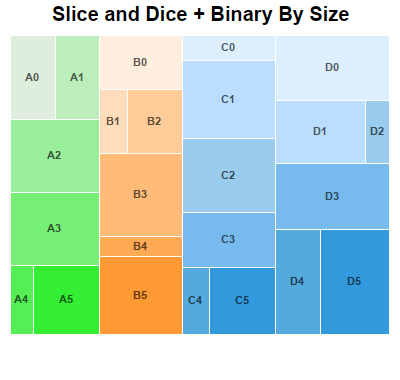
} else if (chartIndex == 3) {
// Layout first level cells using Slice and Dice. Layout second level cells using Binary
// Split By Size.
c.addTitle("Slice and Dice + Binary By Size", "Arial Bold", 15);
root.setLayoutMethod(Chart.TreeMapSliceAndDice);
nodeConfig.setLayoutMethod(Chart.TreeMapBinaryBySize);
} else if (chartIndex == 4) {
// Layout first level cells using Slice and Dice. Layout second level cells using Squarify.
c.addTitle("Slice and Dice + Squarify", "Arial Bold", 15);
root.setLayoutMethod(Chart.TreeMapSliceAndDice);
nodeConfig.setLayoutMethod(Chart.TreeMapSquarify);
} else if (chartIndex == 5) {
// Layout first level cells using Binary Split By Size.. Layout second level cells using
// Strip. With Strip layout, cells flow from left to right, top to bottom. The number of
// cells in each row is such that they will be as close to a square as possible. (The
// setLayoutMethod also supports other flow directions.)
c.addTitle("Binary Split By Size + Strip", "Arial Bold", 15);
root.setLayoutMethod(Chart.TreeMapBinaryBySize);
nodeConfig.setLayoutMethod(Chart.TreeMapStrip);
}
// Output the chart
viewer.setChart(c, Chart.SVG);
// Include tool tip for the chart
viewer.setImageMap(c.getHTMLImageMap("", "", "title='<*cdml*>{parent.label}{index}: {value|2}'")
);
}
%>
<%
// This example includes 6 charts
WebChartViewer[] viewers = new WebChartViewer[6];
for (int i = 0; i < viewers.length; ++i) {
viewers[i] = new WebChartViewer(request, "chart" + i);
createChart(viewers[i], i);
}
%>
<!DOCTYPE html>
<html>
<head>
<title>Multi Level Tree Map Layout</title>
<!-- Include ChartDirector Javascript Library to support chart interactions -->
<script type="text/javascript" src="cdjcv.js"></script>
</head>
<body style="margin:5px 0px 0px 5px">
<div style="font:bold 18pt verdana;">
Multi Level Tree Map Layout
</div>
<hr style="border:solid 1px #000080; background:#000080" />
<div style="font:10pt verdana; margin-bottom:1.5em">
<a href="viewsource.jsp?file=<%=request.getServletPath()%>">View Source Code</a>
</div>
<!-- ****** Here are the chart images ****** -->
<%
for (int i = 0; i < viewers.length; ++i) {
out.write(viewers[i].renderHTML(response));
out.write(" ");
}
%>
</body>
</html>
© 2021 Advanced Software Engineering Limited. All rights reserved.