[JSP Version] jspdemo/multiline.jsp
<%@page import="ChartDirector.*, java.util.*" %>
<%
// The data for the line chart
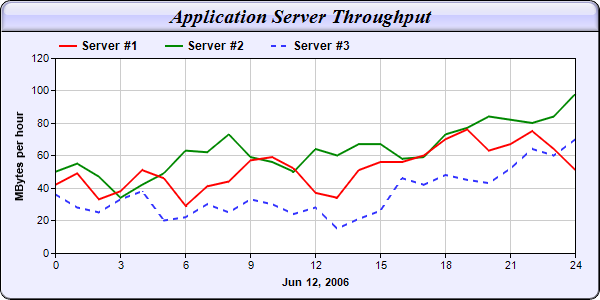
double[] data0 = {42, 49, 33, 38, 51, 46, 29, 41, 44, 57, 59, 52, 37, 34, 51, 56, 56, 60, 70, 76,
63, 67, 75, 64, 51};
double[] data1 = {50, 55, 47, 34, 42, 49, 63, 62, 73, 59, 56, 50, 64, 60, 67, 67, 58, 59, 73, 77,
84, 82, 80, 84, 98};
double[] data2 = {36, 28, 25, 33, 38, 20, 22, 30, 25, 33, 30, 24, 28, 15, 21, 26, 46, 42, 48, 45,
43, 52, 64, 60, 70};
// The labels for the line chart
String[] labels = {"0", "1", "2", "3", "4", "5", "6", "7", "8", "9", "10", "11", "12", "13", "14",
"15", "16", "17", "18", "19", "20", "21", "22", "23", "24"};
// Create an XYChart object of size 600 x 300 pixels, with a light blue (EEEEFF) background, black
// border, 1 pxiel 3D border effect and rounded corners
XYChart c = new XYChart(600, 300, 0xeeeeff, 0x000000, 1);
c.setRoundedFrame();
// Set the plotarea at (55, 58) and of size 520 x 195 pixels, with white background. Turn on both
// horizontal and vertical grid lines with light grey color (0xcccccc)
c.setPlotArea(55, 58, 520, 195, 0xffffff, -1, -1, 0xcccccc, 0xcccccc);
// Add a legend box at (50, 30) (top of the chart) with horizontal layout. Use 9pt Arial Bold font.
// Set the background and border color to Transparent.
c.addLegend(50, 30, false, "Arial Bold", 9).setBackground(Chart.Transparent);
// Add a title box to the chart using 15pt Times Bold Italic font, on a light blue (CCCCFF)
// background with glass effect. white (0xffffff) on a dark red (0x800000) background, with a 1
// pixel 3D border.
c.addTitle("Application Server Throughput", "Times New Roman Bold Italic", 15).setBackground(
0xccccff, 0x000000, Chart.glassEffect());
// Add a title to the y axis
c.yAxis().setTitle("MBytes per hour");
// Set the labels on the x axis.
c.xAxis().setLabels(labels);
// Display 1 out of 3 labels on the x-axis.
c.xAxis().setLabelStep(3);
// Add a title to the x axis
c.xAxis().setTitle("Jun 12, 2006");
// Add a line layer to the chart
LineLayer layer = c.addLineLayer2();
// Set the default line width to 2 pixels
layer.setLineWidth(2);
// Add the three data sets to the line layer. For demo purpose, we use a dash line color for the
// last line
layer.addDataSet(data0, 0xff0000, "Server #1");
layer.addDataSet(data1, 0x008800, "Server #2");
layer.addDataSet(data2, c.dashLineColor(0x3333ff, Chart.DashLine), "Server #3");
// Output the chart
WebChartViewer viewer = new WebChartViewer(request, "chart1");
viewer.setChart(c, Chart.SVG);
// Include tool tip for the chart
viewer.setImageMap(c.getHTMLImageMap("", "", "title='[{dataSetName}] Hour {xLabel}: {value} MBytes'"
));
%>
<!DOCTYPE html>
<html>
<head>
<title>Multi-Line Chart (1)</title>
<!-- Include ChartDirector Javascript Library to support chart interactions -->
<script type="text/javascript" src="cdjcv.js"></script>
</head>
<body style="margin:5px 0px 0px 5px">
<div style="font:bold 18pt verdana;">
Multi-Line Chart (1)
</div>
<hr style="border:solid 1px #000080; background:#000080" />
<div style="font:10pt verdana; margin-bottom:1.5em">
<a href="viewsource.jsp?file=<%=request.getServletPath()%>">View Source Code</a>
</div>
<!-- ****** Here is the chart image ****** -->
<%= viewer.renderHTML(response) %>
</body>
</html>
© 2021 Advanced Software Engineering Limited. All rights reserved.