This example demonstrates using a pattern for filling the area in an area chart, together with a number of chart formatting features.
[JSP Version] jspdemo/patternarea.jsp
<%@page import="ChartDirector.*, java.util.*" %>
<%
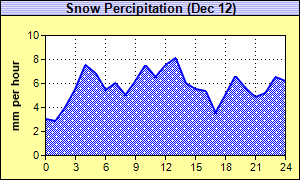
// The data for the area chart
double[] data = {3.0, 2.8, 4.0, 5.5, 7.5, 6.8, 5.4, 6.0, 5.0, 6.2, 7.5, 6.5, 7.5, 8.1, 6.0, 5.5,
5.3, 3.5, 5.0, 6.6, 5.6, 4.8, 5.2, 6.5, 6.2};
// The labels for the area chart
String[] labels = {"0", "1", "2", "3", "4", "5", "6", "7", "8", "9", "10", "11", "12", "13", "14",
"15", "16", "17", "18", "19", "20", "21", "22", "23", "24"};
// Create a XYChart object of size 300 x 180 pixels. Set the background to pale yellow (0xffffa0)
// with a black border (0x0)
XYChart c = new XYChart(300, 180, 0xffffa0, 0x000000);
// Set the plotarea at (45, 35) and of size 240 x 120 pixels. Set the background to white
// (0xffffff). Set both horizontal and vertical grid lines to black (&H0&) dotted lines (pattern
// code 0x0103)
c.setPlotArea(45, 35, 240, 120, 0xffffff, -1, -1, c.dashLineColor(0x000000, 0x000103),
c.dashLineColor(0x000000, 0x000103));
// Add a title to the chart using 10pt Arial Bold font. Use a 1 x 2 bitmap pattern as the
// background. Set the border to black (0x0).
c.addTitle("Snow Percipitation (Dec 12)", "Arial Bold", 10).setBackground(c.patternColor(new int[]{
0xb0b0f0, 0xe0e0ff}, 2), 0x000000);
// Add a title to the y axis
c.yAxis().setTitle("mm per hour");
// Set the labels on the x axis.
c.xAxis().setLabels(labels);
// Display 1 out of 3 labels on the x-axis.
c.xAxis().setLabelStep(3);
// Add an area layer to the chart
AreaLayer layer = c.addAreaLayer();
// Load a snow pattern from an external file "snow.png".
int snowPattern = c.patternColor2("snow.png");
// Add a data set to the area layer using the snow pattern as the fill color. Use deep blue
// (0x0000ff) as the area border line color (&H0000ff&)
layer.addDataSet(data).setDataColor(snowPattern, 0x0000ff);
// Set the line width to 2 pixels to highlight the line
layer.setLineWidth(2);
// Output the chart
WebChartViewer viewer = new WebChartViewer(request, "chart1");
viewer.setChart(c, Chart.SVG);
// Include tool tip for the chart
viewer.setImageMap(c.getHTMLImageMap("", "", "title='{xLabel}:00 - {value} mm/hour'"));
%>
<!DOCTYPE html>
<html>
<head>
<title>Pattern Area Chart</title>
<!-- Include ChartDirector Javascript Library to support chart interactions -->
<script type="text/javascript" src="cdjcv.js"></script>
</head>
<body style="margin:5px 0px 0px 5px">
<div style="font:bold 18pt verdana;">
Pattern Area Chart
</div>
<hr style="border:solid 1px #000080; background:#000080" />
<div style="font:10pt verdana; margin-bottom:1.5em">
<a href="viewsource.jsp?file=<%=request.getServletPath()%>">View Source Code</a>
</div>
<!-- ****** Here is the chart image ****** -->
<%= viewer.renderHTML(response) %>
</body>
</html>
© 2021 Advanced Software Engineering Limited. All rights reserved.