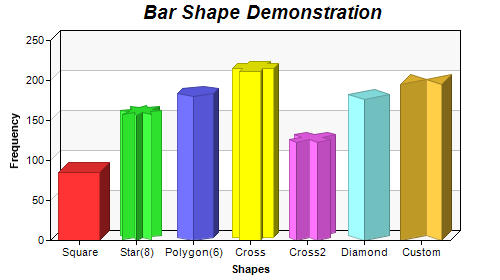
This example demonstrates bars of various polygonal shapes.
ChartDirector supports bars in cylindrical or arbitrary polygonal shapes. This is specified by using
BarLayer.setBarShape and
BarLayer.setBarShape2. In this example, various polygonal shapes are illustrated.
See
Shape Specification on how built-in and custom shapes are defined in ChartDirector.
For demonstration, in this example each bar is of a different shape.
BarLayer.setBarShape and
BarLayer.setBarShape2 also supports setting the bar shapes based on data groups (or data sets) or data item position. For an example, see
Multi-Shape Bar Chart.
[JSP Version] jspdemo/polygonbar.jsp
<%@page import="ChartDirector.*, java.util.*" %>
<%
// The data for the bar chart
double[] data = {85, 156, 179.5, 211, 123, 176, 195};

// The labels for the bar chart
String[] labels = {"Square", "Star(8)", "Polygon(6)", "Cross", "Cross2", "Diamond", "Custom"};

// Create a XYChart object of size 500 x 280 pixels.
XYChart c = new XYChart(500, 280);

// Set the plotarea at (50, 40) with alternating light grey (f8f8f8) / white (ffffff) background
c.setPlotArea(50, 40, 400, 200, 0xf8f8f8, 0xffffff);

// Add a title to the chart using 14pt Arial Bold Italic font
c.addTitle("    Bar Shape Demonstration", "Arial Bold Italic", 14);

// Add a multi-color bar chart layer
BarLayer layer = c.addBarLayer3(data);

// Set layer to 3D with 10 pixels 3D depth
layer.set3D(10);

// Set bar shape to circular (cylinder)
layer.setBarShape(Chart.CircleShape);

// Set the first bar (index = 0) to square shape
layer.setBarShape(Chart.SquareShape, 0, 0);

// Set the second bar to 8-pointed star
layer.setBarShape(Chart.StarShape(8), 0, 1);

// Set the third bar to 6-sided polygon
layer.setBarShape(Chart.PolygonShape(6), 0, 2);

// Set the next 3 bars to cross shape, X shape and diamond shape
layer.setBarShape(Chart.CrossShape(), 0, 3);
layer.setBarShape(Chart.Cross2Shape(), 0, 4);
layer.setBarShape(Chart.DiamondShape, 0, 5);

// Set the last bar to a custom shape, specified as an array of (x, y) points in normalized
// coordinates
int[] customShape = {-500, 0, 0, 500, 500, 0, 500, 1000, 0, 500, -500, 1000};
layer.setBarShape2(customShape, 0, 6);

// Set the labels on the x axis.
c.xAxis().setLabels(labels);

// Add a title to the y axis
c.yAxis().setTitle("Frequency");

// Add a title to the x axis
c.xAxis().setTitle("Shapes");

// Output the chart
WebChartViewer viewer = new WebChartViewer(request, "chart1");
viewer.setChart(c, Chart.SVG);

// Include tool tip for the chart
viewer.setImageMap(c.getHTMLImageMap("", "", "title='{xLabel}: {value}'"));
%>
<!DOCTYPE html>
<html>
<head>
    <title>Polygon Bar Shapes</title>
    <!-- Include ChartDirector Javascript Library to support chart interactions -->
    <script type="text/javascript" src="cdjcv.js"></script>
</head>
<body style="margin:5px 0px 0px 5px">
    <div style="font:bold 18pt verdana;">
        Polygon Bar Shapes
    </div>
    <hr style="border:solid 1px #000080; background:#000080" />
    <div style="font:10pt verdana; margin-bottom:1.5em">
        <a href="viewsource.jsp?file=<%=request.getServletPath()%>">View Source Code</a>
    </div>
    <!-- ****** Here is the chart image ****** -->
    <%= viewer.renderHTML(response) %>
</body>
</html>
© 2021 Advanced Software Engineering Limited. All rights reserved.