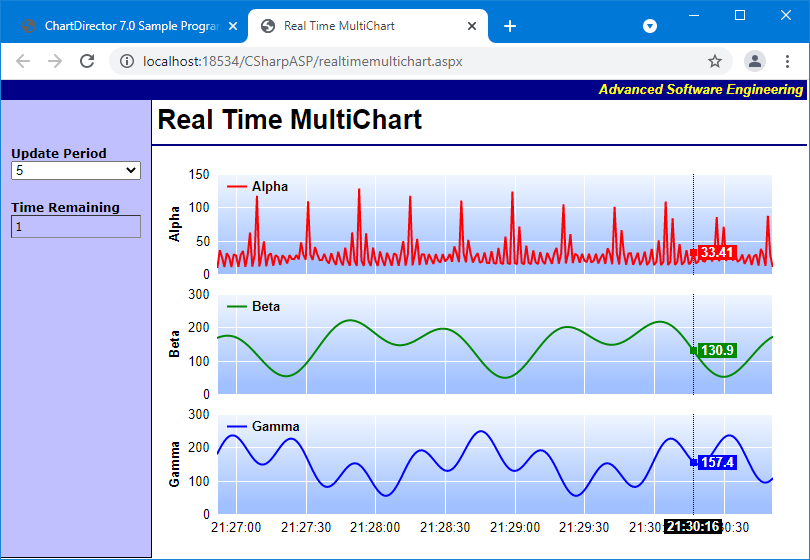
This example demonstrates a real-time multichart with track cursor.
The example is modified from the
Real-Time Chart with Track Line example with the following changes:
- Instead of an XYChart with 3 lines, this example draws a MultiChart containing 3 XYCharts, each with 1 line. The 3 charts are stacked and only the bottom chart has a visible x-axis.
- The track cursor code is modified to use a loop to draw 3 track cursors on the 3 XYCharts.
[JSP Version] jspdemo/realtimemultichart.jsp
<%@page import="ChartDirector.*, java.util.*" %>
<%!
//
// Draw a single chart
//
private XYChart drawXYChart(WebChartViewer viewer, Date[] timeStamps, double[] dataSeries,
    String name, int color, Axis xAxisScale, boolean xAxisVisible)
{
    // Only the last chart has an x-axis
    int xAxisHeight = 25;
    if (!xAxisVisible) {
        xAxisHeight = 0;
    }

    // Create an XYChart object of size 640 x 120 pixels (excluding x-axis height)
    XYChart c = new XYChart(640, 120 + xAxisHeight);

    // Set the plotarea at (55, 10) with width 85 pixels less than chart width, and height 20 pixels
    // less than chart height. Use a vertical gradient from light blue (f0f6ff) to sky blue (a0c0ff)
    // as background. Set border to transparent and grid lines to white (ffffff).
    c.setPlotArea(55, 10, c.getWidth() - 85, c.getHeight() - 20 - xAxisHeight,
        c.linearGradientColor(0, 10, 0, c.getHeight() - 20 - xAxisHeight, 0xf0f6ff, 0xa0c0ff), -1,
        Chart.Transparent, 0xffffff, 0xffffff);

    // As the data can lie outside the plotarea in a zoomed chart, we need enable clipping.
    c.setClipping();

    // Add a legend box at (55, 5) using horizontal layout. Use 8pts Arial Bold as font. Set the
    // background and border color to Transparent and use line style legend key.
    LegendBox b = c.addLegend(55, 5, false, "Arial Bold", 10);
    b.setBackground(Chart.Transparent);
    b.setLineStyleKey();

    // Set the x and y axis stems to transparent and the label font to 10pt Arial
    c.xAxis().setColors(Chart.Transparent);
    c.yAxis().setColors(Chart.Transparent);
    c.xAxis().setLabelStyle("Arial", 10);
    c.yAxis().setLabelStyle("Arial", 10);

    // Add axis title using 10pts Arial Bold Italic font
    c.yAxis().setTitle(name, "Arial Bold", 10);

    //================================================================================
    // Add data to chart
    //================================================================================

    // Add a line layer with the given data, with a line width of 2 pixels.
    LineLayer layer = c.addLineLayer();
    layer.setLineWidth(2);
    layer.setXData(timeStamps);
    layer.addDataSet(dataSeries, color, name);

    //================================================================================
    // Configure axis scale and labelling
    //================================================================================

    // For the automatic axis labels, set the minimum spacing to 30 pixels for the y axis.
    c.yAxis().setTickDensity(30);

    if (xAxisScale == null) {
        // If xAxisScale is given, then use it to synchronize with other charts.
        c.xAxis().copyAxis(xAxisScale);
    } else {
        // Set the x-axis label format
        c.xAxis().setLabelFormat("{value|hh:nn:ss}");
    }

    // Hide the x-axis if it is not visible.
    if (!xAxisVisible) {
        c.xAxis().setColors(Chart.Transparent, Chart.Transparent);
    }

    //================================================================================
    // Output the chart
    //================================================================================

    return c;
}

//
// Draw the MultiChart
//
private void drawChart(WebChartViewer viewer)
{
    //
    // Data to draw the chart. In this demo, the data buffer will be filled by a random data
    // generator. In real life, the data is probably stored in a buffer (eg. a database table, a
    // text file, or some global memory) and updated by other means.
    //

    // We use a data buffer to emulate the last 240 samples.
    int sampleSize = 240;
    double[] dataSeries1 = new double[sampleSize];
    double[] dataSeries2 = new double[sampleSize];
    double[] dataSeries3 = new double[sampleSize];
    Date[] timeStamps = new Date[sampleSize];

    // Our pseudo random number generator
    double firstDate = new Date().getTime() / 1000 - timeStamps.length;
    for(int i = 0; i < timeStamps.length; ++i) {
        double p = firstDate + i;
        timeStamps[i] = new Date((long)p * 1000);
        dataSeries1[i] = Math.cos(p * 2.1) * 10 + 1 / (Math.cos(p) * Math.cos(p) + 0.01) + 20;
        dataSeries2[i] = 100 * Math.sin(p / 27.7) * Math.sin(p / 10.1) + 150;
        dataSeries3[i] = 100 * Math.cos(p / 6.7) * Math.cos(p / 11.9) + 150;
    }

    // The MultiChart, initially set to a height 10 pixels as the top margin.
    MultiChart m = new MultiChart(640, 10);

    // This first chart is responsible for setting up the x-axis scale.
    XYChart xyc = drawXYChart(viewer, timeStamps, dataSeries1, "Alpha", 0xff0000, null, false);
    Axis xAxisScale = xyc.xAxis();

    // Add the XYChart to the MultiChart and increase the MultiChart height
    m.addChart(0, m.getHeight(), xyc);
    m.setSize(m.getWidth(), m.getHeight() + xyc.getHeight());

    // All other charts synchronize their x-axes with that of the first chart.
    xyc = drawXYChart(viewer, timeStamps, dataSeries2, "Beta", 0x008800, xAxisScale, false);

    // Add the XYChart to the MultiChart and increase the MultiChart height
    m.addChart(0, m.getHeight(), xyc);
    m.setSize(m.getWidth(), m.getHeight() + xyc.getHeight());

    // The last chart displays the x-axis.
    xyc = drawXYChart(viewer, timeStamps, dataSeries3, "Gamma", 0x0000ff, xAxisScale, true);

    // Add the XYChart to the MultiChart and increase the MultiChart height
    m.addChart(0, m.getHeight(), xyc);
    m.setSize(m.getWidth(), m.getHeight() + xyc.getHeight());

    // Set the combined plot area to be the bounding box of the plot areas of the 3 charts
    m.setMainChart(m);

    // Output the chart
    viewer.setChart(m, Chart.SVG);

    // Output Javascript chart model to the browser to support tracking cursor
    viewer.setChartModel(m.getJsChartModel());
}
%>
<%

//
// This script handles both the full page request, as well as the subsequent partial updates (AJAX
// chart updates). We need to determine the type of request first before we processing it.
//

// Create the WebChartViewer object
WebChartViewer viewer = new WebChartViewer(request, "chart1");

if (viewer.isPartialUpdateRequest()) {
    // Is a partial update request. Draw the chart and perform a partial response.
    drawChart(viewer);
    out.clear();
    viewer.partialUpdateChart(response);
    return;
}

//
// If the code reaches here, it is a full page request.
//

drawChart(viewer);
%>
<!DOCTYPE html>
<html>
<head>
    <title>Real Time MultiChart</title>
    <script type="text/javascript" src="cdjcv.js"></script>
</head>
<body style="margin:0px">
<script type="text/javascript">

//
// Execute the following initialization code after the web page is loaded
//
JsChartViewer.addEventListener(window, 'load', function() {
    var viewer = JsChartViewer.get('<%=viewer.getId()%>');

    // Draw track cursor when mouse is moving over plotarea. Hide it when mouse leaves plot area.
    viewer.attachHandler(["MouseMovePlotArea", "TouchStartPlotArea", "TouchMovePlotArea", "ChartMove",
        "PostUpdate", "Now"], function(e) {
        this.preventDefault(e);   // Prevent the browser from using touch events for other actions
        multiTrackLineLabel(viewer, viewer.getPlotAreaMouseX());
    });

    // When the chart is being updated, by default, an "Updating" box will pop up. In this example, we
    // will disable this box.
    viewer.updatingMsg = "";
});

//
// Draw track line for a MultiChart
//
function multiTrackLineLabel(viewer, mouseX)
{
    // Remove all previously drawn tracking object
    viewer.hideObj("all");

    // Use a loop to draw track labels for the XYCharts inside the MultiChart
    for (var i = 0; i < viewer.getChartCount(); ++i)
        // Only the bottom chart (i == viewer.getChartCount() - 1) needs x-axis label.
        xyChartTrackLabel(viewer, mouseX, viewer.getChart(i), i, i == viewer.getChartCount() - 1);
}

//
// Draw xy chart track label
//
function xyChartTrackLabel(viewer, mouseX, c, id, needXAxisLabel)
{
    // The plot area
    var plotArea = c.getPlotArea();

    // The XYChart API object obtains the various coordinates relative to the top-left corner
    // of the XYChart. However, it needs to draw the track cursor on the MultiChart. So we need
    // to obtain the coordinates of the XYChart top-left corner inside the MultiChart.
    var originX = c.getAbsOffsetX();
    var originY = c.getAbsOffsetY();

    // Get the data x-value that is nearest to the mouse, and find its pixel coordinate.
    var xValue = c.getNearestXValue(mouseX);
    var xCoor = originX + c.getXCoor(xValue);

    // Draw a vertical track line at the x-position
    viewer.drawVLine("trackLine_" + id, xCoor, originY + plotArea.getTopY(),
        originY + plotArea.getBottomY(), "black 1px dotted");

    // Only the last chart needs to draw the x-axis label
    if (needXAxisLabel)
    {
        viewer.showTextBox("xAxisLabel_" + id, xCoor, originY + plotArea.getBottomY()
            + 5, JsChartViewer.Top, c.xAxis().getFormattedLabel(xValue, "hh:nn:ss"),
            "font:bold 13px Arial;color:#FFFFFF;background-color:#000000;padding:0px 3px");
    }

    // Iterate through all layers to draw the data labels
    for (var i = 0; i < c.getLayerCount(); ++i)
    {
        var layer = c.getLayerByZ(i);

        // The data array index of the x-value
        var xIndex = layer.getXIndexOf(xValue);

        // Iterate through all the data sets in the layer
        for (var j = 0; j < layer.getDataSetCount(); ++j)
        {
            var dataSet = layer.getDataSetByZ(j);

            // Get the color and position of the data label
            var color = dataSet.getDataColor();
            var yCoor = c.getYCoor(dataSet.getPosition(xIndex), dataSet.getUseYAxis());

            // Draw a track dot with a label next to it for visible data points in the plot area
            if ((yCoor != null) && (yCoor >= plotArea.getTopY()) && (yCoor <= plotArea.getBottomY())
                && (color != null))
            {
                viewer.showTextBox("dataPoint_" + id + "_" + i + "_" + j, xCoor,
                    originY + yCoor, JsChartViewer.Center, viewer.htmlRect(7, 7, color));

                viewer.showTextBox("dataLabel" + id + "_" + i + "_" + j, xCoor + 5,
                    originY + yCoor, JsChartViewer.Left, dataSet.getValue(xIndex).toPrecision(4),
                    "padding:0px 3px;font:bold 13px Arial;background-color:" + color +
                    ";color:#FFFFFF;-webkit-text-size-adjust:100%;");
            }
        }
    }
}

//
// Executes once every second to update the countdown display. Updates the chart when the countdown reaches 0.
//
function timerTick()
{
    // Get the update period and the time left
    var updatePeriod = parseInt(document.getElementById("UpdatePeriod").value);
    var timeLeft = Math.min(parseInt(document.getElementById("TimeRemaining").innerHTML), updatePeriod) - 1;

    if (timeLeft == 0)
        // Can update the chart now
        JsChartViewer.get('<%=viewer.getId()%>').partialUpdate();
    else if (timeLeft < 0)
        // Reset the update period
        timeLeft += updatePeriod;

    // Update the countdown display
    document.getElementById("TimeRemaining").innerHTML = timeLeft;
}
window.setInterval("timerTick()", 1000);

</script>
<table cellspacing="0" cellpadding="0" border="0">
    <tr>
        <td align="right" colspan="2" style="background:#000088; color:#ffff00; padding:0px 4px 2px 0px;">
            <a style="color:#FFFF00; font:italic bold 10pt Arial; text-decoration:none" href="http://www.advsofteng.com/">
                Advanced Software Engineering
            </a>
        </td>
    </tr>
    <tr valign="top">
        <td style="width:150px; background:#c0c0ff; border-right:black 1px solid; border-bottom:black 1px solid;">
            <br />
            <br />
            <div style="font: 9pt Verdana; padding:10px;">
                <b>Update Period</b><br />
                <select id="UpdatePeriod" style="width:130px">
                    <option value="5" selected="selected">5</option>
                    <option value="10">10</option>
                    <option value="20">20</option>
                    <option value="30">30</option>
                    <option value="60">60</option>
                </select>
            </div>
            <div style="font:9pt Verdana; padding:10px;">
                <b>Time Remaining</b><br />
                <div style="width:128px; border:#888888 1px inset;">
                    <div style="margin:3px" id="TimeRemaining">0</div>
                </div>
            </div>
        </td>
        <td>
            <div style="font: bold 20pt Arial; margin:5px 0px 0px 5px;">
                Real Time MultiChart
            </div>
            <hr style="border:solid 1px #000080" />
            <div style="padding:0px 5px 5px 10px">
                <!-- ****** Here is the chart image ****** -->
                <%=viewer.renderHTML(response)%>
            </div>
        </td>
    </tr>
</table>
</body>
</html>
© 2021 Advanced Software Engineering Limited. All rights reserved.