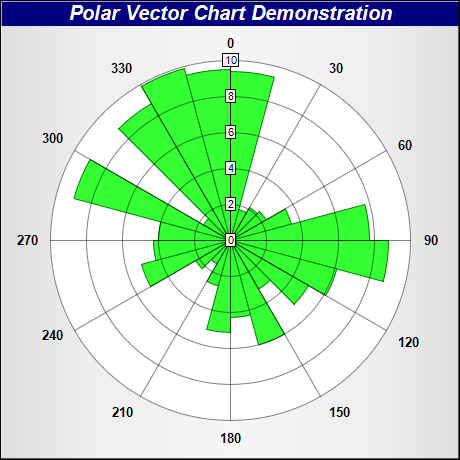
This example demonstrates how to create a rose chart.
A rose chart is basically a polar chart with sectors of variable radius. This can be achieved by creating a
PolarChart object as the graph paper, and adding sector zones on it using
AngularAxis.addZone.
To enable auto-scale of the axis, in this example, we also add the radius data to a transparent line layer using
PolarChart.addLineLayer. The line layer has no visible effect, but it causes the radial axis to auto-scale so that it covers the radius data.
[JSP Version] jspdemo/rose.jsp
<%@page import="ChartDirector.*, java.util.*" %>
<%
// Data for the chart
double[] data = {9.4, 1.8, 2.1, 2.3, 3.5, 7.7, 8.8, 6.1, 5.0, 3.1, 6.0, 4.3, 5.1, 2.6, 1.5, 2.2,
    5.1, 4.3, 4.0, 9.0, 1.7, 8.8, 9.9, 9.5};
double[] angles = {0, 15, 30, 45, 60, 75, 90, 105, 120, 135, 150, 165, 180, 195, 210, 225, 240, 255,
    270, 285, 300, 315, 330, 345};

// Create a PolarChart object of size 460 x 460 pixels, with a silver background and a 1 pixel 3D
// border
PolarChart c = new PolarChart(460, 460, Chart.silverColor(), 0x000000, 1);

// Add a title to the chart at the top left corner using 15pt Arial Bold Italic font. Use white text
// on deep blue background.
c.addTitle("Polar Vector Chart Demonstration", "Arial Bold Italic", 15, 0xffffff).setBackground(
    0x000080);

// Set plot area center at (230, 240) with radius 180 pixels and white background
c.setPlotArea(230, 240, 180, 0xffffff);

// Set the grid style to circular grid
c.setGridStyle(false);

// Set angular axis as 0 - 360, with a spoke every 30 units
c.angularAxis().setLinearScale(0, 360, 30);

// Add sectors to the chart as sector zones
for(int i = 0; i < data.length; ++i) {
    c.angularAxis().addZone(angles[i], angles[i] + 15, 0, data[i], 0x33ff33, 0x008000);
}

// Add an Transparent invisible layer to ensure the axis is auto-scaled using the data
c.addLineLayer(data, Chart.Transparent);

// Output the chart
WebChartViewer viewer = new WebChartViewer(request, "chart1");
viewer.setChart(c, Chart.SVG);
%>
<!DOCTYPE html>
<html>
<head>
    <title>Simple Rose Chart</title>
    <!-- Include ChartDirector Javascript Library to support chart interactions -->
    <script type="text/javascript" src="cdjcv.js"></script>
</head>
<body style="margin:5px 0px 0px 5px">
    <div style="font:bold 18pt verdana;">
        Simple Rose Chart
    </div>
    <hr style="border:solid 1px #000080; background:#000080" />
    <div style="font:10pt verdana; margin-bottom:1.5em">
        <a href="viewsource.jsp?file=<%=request.getServletPath()%>">View Source Code</a>
    </div>
    <!-- ****** Here is the chart image ****** -->
    <%= viewer.renderHTML(response) %>
</body>
</html>
© 2021 Advanced Software Engineering Limited. All rights reserved.