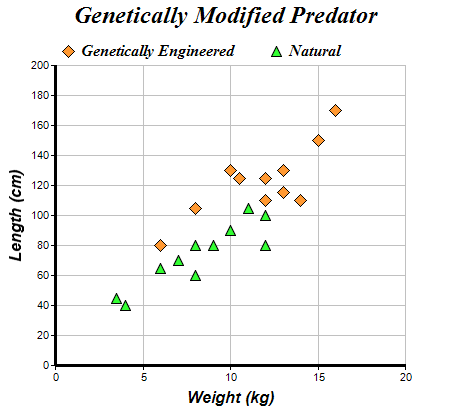
This example demonstrates a scatter chart created using XYChart.addScatterLayer.
ChartDirector 7.0 (Java Edition)
Scatter Chart
Source Code Listing
<%@page import="ChartDirector.*, java.util.*" %>
<%
// The XY points for the scatter chart
double[] dataX0 = {10, 15, 6, 12, 14, 8, 13, 13, 16, 12, 10.5};
double[] dataY0 = {130, 150, 80, 110, 110, 105, 130, 115, 170, 125, 125};

double[] dataX1 = {6, 12, 4, 3.5, 7, 8, 9, 10, 12, 11, 8};
double[] dataY1 = {65, 80, 40, 45, 70, 80, 80, 90, 100, 105, 60};

// Create a XYChart object of size 450 x 420 pixels
XYChart c = new XYChart(450, 420);

// Set the plotarea at (55, 65) and of size 350 x 300 pixels, with a light grey border (0xc0c0c0).
// Turn on both horizontal and vertical grid lines with light grey color (0xc0c0c0)
c.setPlotArea(55, 65, 350, 300, -1, -1, 0xc0c0c0, 0xc0c0c0, -1);

// Add a legend box at (50, 30) (top of the chart) with horizontal layout. Use 12pt Times Bold
// Italic font. Set the background and border color to Transparent.
c.addLegend(50, 30, false, "Times New Roman Bold Italic", 12).setBackground(Chart.Transparent);

// Add a title to the chart using 18pt Times Bold Itatic font.
c.addTitle("Genetically Modified Predator", "Times New Roman Bold Italic", 18);

// Add a title to the y axis using 12pt Arial Bold Italic font
c.yAxis().setTitle("Length (cm)", "Arial Bold Italic", 12);

// Add a title to the x axis using 12pt Arial Bold Italic font
c.xAxis().setTitle("Weight (kg)", "Arial Bold Italic", 12);

// Set the axes line width to 3 pixels
c.xAxis().setWidth(3);
c.yAxis().setWidth(3);

// Add an orange (0xff9933) scatter chart layer, using 13 pixel diamonds as symbols
c.addScatterLayer(dataX0, dataY0, "Genetically Engineered", Chart.DiamondSymbol, 13, 0xff9933);

// Add a green (0x33ff33) scatter chart layer, using 11 pixel triangles as symbols
c.addScatterLayer(dataX1, dataY1, "Natural", Chart.TriangleSymbol, 11, 0x33ff33);

// Output the chart
WebChartViewer viewer = new WebChartViewer(request, "chart1");
viewer.setChart(c, Chart.SVG);

// Include tool tip for the chart
viewer.setImageMap(c.getHTMLImageMap("", "",
    "title='[{dataSetName}] Weight = {x} kg, Length = {value} cm'"));
%>
<!DOCTYPE html>
<html>
<head>
    <title>Scatter Chart</title>
    <!-- Include ChartDirector Javascript Library to support chart interactions -->
    <script type="text/javascript" src="cdjcv.js"></script>
</head>
<body style="margin:5px 0px 0px 5px">
    <div style="font:bold 18pt verdana;">
        Scatter Chart
    </div>
    <hr style="border:solid 1px #000080; background:#000080" />
    <div style="font:10pt verdana; margin-bottom:1.5em">
        <a href="viewsource.jsp?file=<%=request.getServletPath()%>">View Source Code</a>
    </div>
    <!-- ****** Here is the chart image ****** -->
    <%= viewer.renderHTML(response) %>
</body>
</html>