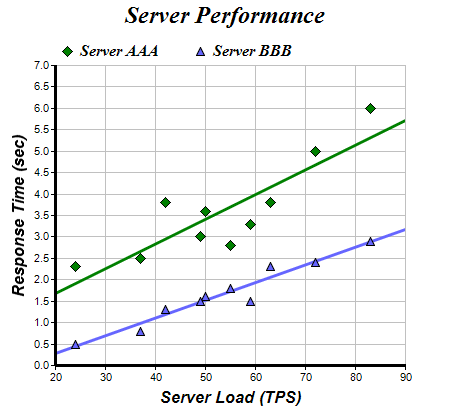
This example demonstrates linear regression trend line fitting together with scatter layers.
The chart in this example has 4 layers - 2 scatter layers created using
XYChart.addScatterLayer to show the data points, and two trend layers created using
XYChart.addTrendLayer2 for the two trend lines.
[JSP Version] jspdemo/scattertrend.jsp
<%@page import="ChartDirector.*, java.util.*" %>
<%
// The XY data of the first data series
double[] dataX0 = {50, 55, 37, 24, 42, 49, 63, 72, 83, 59};
double[] dataY0 = {3.6, 2.8, 2.5, 2.3, 3.8, 3.0, 3.8, 5.0, 6.0, 3.3};

// The XY data of the second data series
double[] dataX1 = {50, 55, 37, 24, 42, 49, 63, 72, 83, 59};
double[] dataY1 = {1.6, 1.8, 0.8, 0.5, 1.3, 1.5, 2.3, 2.4, 2.9, 1.5};

// Tool tip formats for data points and trend lines
String scatterToolTip = "title='{dataSetName}: Response time at {x} TPS: {value} sec'";
String trendToolTip = "title='Slope = {slope|4} sec/TPS; Intercept = {intercept|4} sec'";

// Create a XYChart object of size 450 x 420 pixels
XYChart c = new XYChart(450, 420);

// Set the plotarea at (55, 65) and of size 350 x 300 pixels, with white background and a light grey
// border (0xc0c0c0). Turn on both horizontal and vertical grid lines with light grey color
// (0xc0c0c0)
c.setPlotArea(55, 65, 350, 300, 0xffffff, -1, 0xc0c0c0, 0xc0c0c0, -1);

// Add a legend box at (50, 30) (top of the chart) with horizontal layout. Use 12pt Times Bold
// Italic font. Set the background and border color to Transparent.
c.addLegend(50, 30, false, "Times New Roman Bold Italic", 12).setBackground(Chart.Transparent);

// Add a title to the chart using 18 point Times Bold Itatic font.
c.addTitle("Server Performance", "Times New Roman Bold Italic", 18);

// Add titles to the axes using 12pt Arial Bold Italic font
c.yAxis().setTitle("Response Time (sec)", "Arial Bold Italic", 12);
c.xAxis().setTitle("Server Load (TPS)", "Arial Bold Italic", 12);

// Set the axes line width to 3 pixels
c.yAxis().setWidth(3);
c.xAxis().setWidth(3);

// Add a scatter layer using (dataX0, dataY0)
ScatterLayer scatter1 = c.addScatterLayer(dataX0, dataY0, "Server AAA", Chart.DiamondSymbol, 11,
    0x008000);
scatter1.setHTMLImageMap("", "", scatterToolTip);

// Add a trend line layer for (dataX0, dataY0)
TrendLayer trend1 = c.addTrendLayer2(dataX0, dataY0, 0x008000);
trend1.setLineWidth(3);
trend1.setHTMLImageMap("", "", trendToolTip);

// Add a scatter layer for (dataX1, dataY1)
ScatterLayer scatter2 = c.addScatterLayer(dataX1, dataY1, "Server BBB", Chart.TriangleSymbol, 9,
    0x6666ff);
scatter2.setHTMLImageMap("", "", scatterToolTip);

// Add a trend line layer for (dataX1, dataY1)
TrendLayer trend2 = c.addTrendLayer2(dataX1, dataY1, 0x6666ff);
trend2.setLineWidth(3);
trend2.setHTMLImageMap("", "", trendToolTip);

// Output the chart
WebChartViewer viewer = new WebChartViewer(request, "chart1");
viewer.setChart(c, Chart.SVG);

// include tool tip for the chart
viewer.setImageMap(c.getHTMLImageMap(""));
%>
<!DOCTYPE html>
<html>
<head>
    <title>Scatter Trend Chart</title>
    <!-- Include ChartDirector Javascript Library to support chart interactions -->
    <script type="text/javascript" src="cdjcv.js"></script>
</head>
<body style="margin:5px 0px 0px 5px">
    <div style="font:bold 18pt verdana;">
        Scatter Trend Chart
    </div>
    <hr style="border:solid 1px #000080; background:#000080" />
    <div style="font:10pt verdana; margin-bottom:1.5em">
        <a href="viewsource.jsp?file=<%=request.getServletPath()%>">View Source Code</a>
    </div>
    <!-- ****** Here is the chart image ****** -->
    <%= viewer.renderHTML(response) %>
</body>
</html>
© 2021 Advanced Software Engineering Limited. All rights reserved.