This example demonstrates the basic steps in creating pie charts.
[JSP Version] jspdemo/simplepie.jsp
<%@page import="ChartDirector.*, java.util.*" %>
<%
// The data for the pie chart
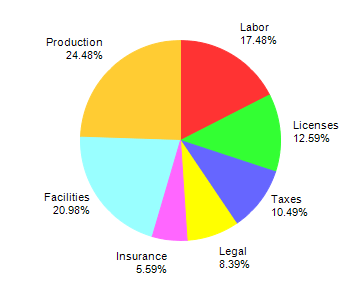
double[] data = {25, 18, 15, 12, 8, 30, 35};
// The labels for the pie chart
String[] labels = {"Labor", "Licenses", "Taxes", "Legal", "Insurance", "Facilities", "Production"};
// Create a PieChart object of size 360 x 300 pixels
PieChart c = new PieChart(360, 300);
// Set the center of the pie at (180, 140) and the radius to 100 pixels
c.setPieSize(180, 140, 100);
// Set the pie data and the pie labels
c.setData(data, labels);
// Output the chart
WebChartViewer viewer = new WebChartViewer(request, "chart1");
viewer.setChart(c, Chart.SVG);
// Include tool tip for the chart
viewer.setImageMap(c.getHTMLImageMap("", "", "title='{label}: US${value}K ({percent}%)'"));
%>
<!DOCTYPE html>
<html>
<head>
<title>Simple Pie Chart</title>
<!-- Include ChartDirector Javascript Library to support chart interactions -->
<script type="text/javascript" src="cdjcv.js"></script>
</head>
<body style="margin:5px 0px 0px 5px">
<div style="font:bold 18pt verdana;">
Simple Pie Chart
</div>
<hr style="border:solid 1px #000080; background:#000080" />
<div style="font:10pt verdana; margin-bottom:1.5em">
<a href="viewsource.jsp?file=<%=request.getServletPath()%>">View Source Code</a>
</div>
<!-- ****** Here is the chart image ****** -->
<%= viewer.renderHTML(response) %>
</body>
</html>
© 2021 Advanced Software Engineering Limited. All rights reserved.