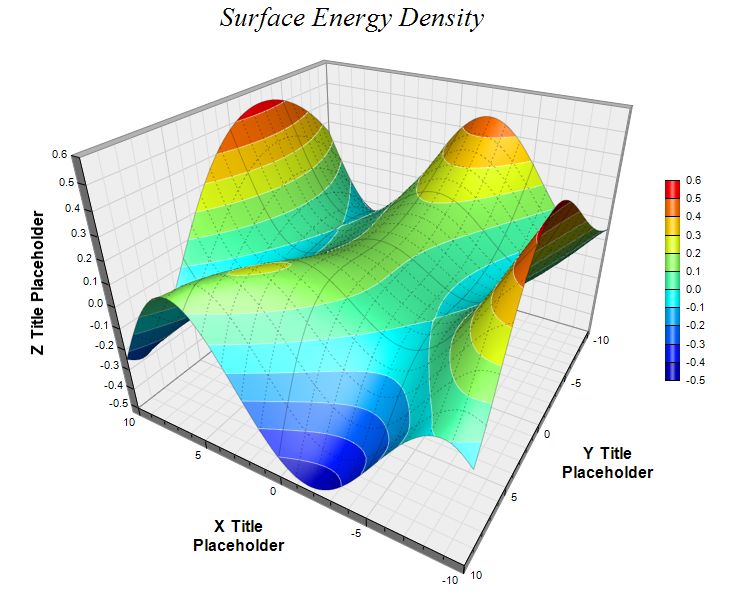
This example demonstrates using deep perspective. It also demonstrates surface grid lines of different line styles.
[JSP Version] jspdemo/surface3.jsp
<%@page import="ChartDirector.*, java.util.*" %>
<%
// The x and y coordinates of the grid
double[] dataX = {-10, -9, -8, -7, -6, -5, -4, -3, -2, -1, 0, 1, 2, 3, 4, 5, 6, 7, 8, 9, 10};
double[] dataY = {-10, -9, -8, -7, -6, -5, -4, -3, -2, -1, 0, 1, 2, 3, 4, 5, 6, 7, 8, 9, 10};

// The values at the grid points. In this example, we will compute the values using the formula z =
// Sin(x * x / 128 - y * y / 256 + 3) * Cos(x / 4 + 1 - Exp(y / 8))
double[] dataZ = new double[dataX.length * dataY.length];
for(int yIndex = 0; yIndex < dataY.length; ++yIndex) {
    double y = dataY[yIndex];
    for(int xIndex = 0; xIndex < dataX.length; ++xIndex) {
        double x = dataX[xIndex];
        dataZ[yIndex * dataX.length + xIndex] = Math.sin(x * x / 128.0 - y * y / 256.0 + 3) *
            Math.cos(x / 4.0 + 1 - Math.exp(y / 8.0));
    }
}

// Create a SurfaceChart object of size 750 x 600 pixels
SurfaceChart c = new SurfaceChart(750, 600);

// Add a title to the chart using 20 points Times New Roman Italic font
c.addTitle("Surface Energy Density       ", "Times New Roman Italic", 20);

// Set the center of the plot region at (380, 260), and set width x depth x height to 360 x 360 x
// 270 pixels
c.setPlotRegion(380, 260, 360, 360, 270);

// Set the elevation and rotation angles to 30 and 210 degrees
c.setViewAngle(30, 210);

// Set the perspective level to 60
c.setPerspective(60);

// Set the data to use to plot the chart
c.setData(dataX, dataY, dataZ);

// Spline interpolate data to a 80 x 80 grid for a smooth surface
c.setInterpolation(80, 80);

// Use semi-transparent black (c0000000) for x and y major surface grid lines. Use dotted style for
// x and y minor surface grid lines.
int majorGridColor = 0xc0000000;
int minorGridColor = c.dashLineColor(majorGridColor, Chart.DotLine);
c.setSurfaceAxisGrid(majorGridColor, majorGridColor, minorGridColor, minorGridColor);

// Set contour lines to semi-transparent white (80ffffff)
c.setContourColor(0x80ffffff);

// Add a color axis (the legend) in which the left center is anchored at (665, 280). Set the length
// to 200 pixels and the labels on the right side.
c.setColorAxis(665, 280, Chart.Left, 200, Chart.Right);

// Set the x, y and z axis titles using 12 points Arial Bold font
c.xAxis().setTitle("X Title\nPlaceholder", "Arial Bold", 12);
c.yAxis().setTitle("Y Title\nPlaceholder", "Arial Bold", 12);
c.zAxis().setTitle("Z Title Placeholder", "Arial Bold", 12);

// Output the chart
WebChartViewer viewer = new WebChartViewer(request, "chart1");
viewer.setChart(c, Chart.SVG);

// Include tool tip for the chart
viewer.setImageMap(c.getHTMLImageMap("", "", "title='<*cdml*>X: {x|2}<*br*>Y: {y|2}<*br*>Z: {z|2}'")
    );
%>
<!DOCTYPE html>
<html>
<head>
    <title>Surface Chart (3)</title>
    <!-- Include ChartDirector Javascript Library to support chart interactions -->
    <script type="text/javascript" src="cdjcv.js"></script>
</head>
<body style="margin:5px 0px 0px 5px">
    <div style="font:bold 18pt verdana;">
        Surface Chart (3)
    </div>
    <hr style="border:solid 1px #000080; background:#000080" />
    <div style="font:10pt verdana; margin-bottom:1.5em">
        <a href="viewsource.jsp?file=<%=request.getServletPath()%>">View Source Code</a>
    </div>
    <!-- ****** Here is the chart image ****** -->
    <%= viewer.renderHTML(response) %>
</body>
</html>
© 2021 Advanced Software Engineering Limited. All rights reserved.