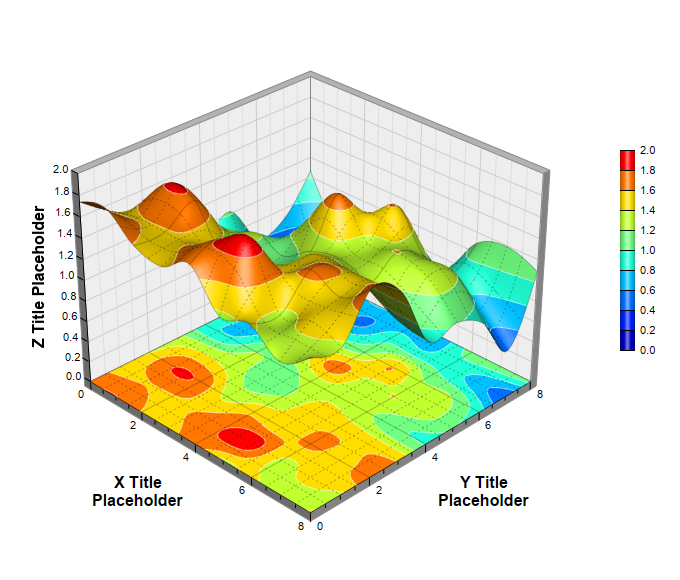
This example demonstrates adding a surface projection to the XY wall using SurfaceChart.addXYProjection.
ChartDirector 7.0 (Java Edition)
Surface Projection
Source Code Listing
<%@page import="ChartDirector.*, java.util.*" %>
<%
// The x and y coordinates of the grid
double[] dataX = {0, 1, 2, 3, 4, 5, 6, 7, 8};
double[] dataY = {0, 1, 2, 3, 4, 5, 6, 7, 8};

// Use random numbers for the z values on the XY grid
RanSeries r = new RanSeries(11);
double[] dataZ = r.get2DSeries(dataX.length, dataY.length, 0.1, 1.9);

// Create a SurfaceChart object of size 680 x 580 pixels
SurfaceChart c = new SurfaceChart(680, 580);

// Set the center of the plot region at (310, 280), and set width x depth x height to 320 x 320 x
// 240 pixels
c.setPlotRegion(310, 280, 320, 320, 240);

// Set the elevation and rotation angles to 30 and 45 degrees
c.setViewAngle(30, 45);

// Set the data to use to plot the chart
c.setData(dataX, dataY, dataZ);

// Spline interpolate data to a 80 x 80 grid for a smooth surface
c.setInterpolation(80, 80);

// Use semi-transparent black (c0000000) for x and y major surface grid lines. Use dotted style for
// x and y minor surface grid lines.
int majorGridColor = 0xc0000000;
int minorGridColor = c.dashLineColor(majorGridColor, Chart.DotLine);
c.setSurfaceAxisGrid(majorGridColor, majorGridColor, minorGridColor, minorGridColor);

// Add XY projection
c.addXYProjection();

// Set contour lines to semi-transparent white (0x7fffffff)
c.setContourColor(0x7fffffff);

// Add a color axis (the legend) in which the left center is anchored at (620, 250). Set the length
// to 200 pixels and the labels on the right side.
c.setColorAxis(620, 250, Chart.Left, 200, Chart.Right);

// Set the x, y and z axis titles using 12 pt Arial Bold font
c.xAxis().setTitle("X Title<*br*>Placeholder", "Arial Bold", 12);
c.yAxis().setTitle("Y Title<*br*>Placeholder", "Arial Bold", 12);
c.zAxis().setTitle("Z Title Placeholder", "Arial Bold", 12);

// Output the chart
WebChartViewer viewer = new WebChartViewer(request, "chart1");
viewer.setChart(c, Chart.SVG);

// Include tool tip for the chart
viewer.setImageMap(c.getHTMLImageMap("", "", "title='<*cdml*>X: {x|2}<*br*>Y: {y|2}<*br*>Z: {z|2}'")
    );
%>
<!DOCTYPE html>
<html>
<head>
    <title>Surface Projection</title>
    <!-- Include ChartDirector Javascript Library to support chart interactions -->
    <script type="text/javascript" src="cdjcv.js"></script>
</head>
<body style="margin:5px 0px 0px 5px">
    <div style="font:bold 18pt verdana;">
        Surface Projection
    </div>
    <hr style="border:solid 1px #000080; background:#000080" />
    <div style="font:10pt verdana; margin-bottom:1.5em">
        <a href="viewsource.jsp?file=<%=request.getServletPath()%>">View Source Code</a>
    </div>
    <!-- ****** Here is the chart image ****** -->
    <%= viewer.renderHTML(response) %>
</body>
</html>