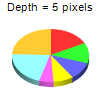
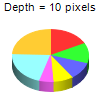
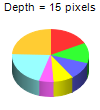
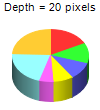
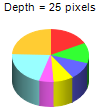
This example demonstrates the effects of different 3D depths.
ChartDirector allows the 3D depth and angles to be configured using PieChart.set3D and PieChart.set3D2.
ChartDirector 7.0 (Java Edition)
3D Depth
Source Code Listing
<%@page import="ChartDirector.*, java.util.*" %>
<%!
// Function to create the demo charts
void createChart(WebChartViewer viewer, int chartIndex)
{
    // the tilt angle of the pie
    int depth = chartIndex * 5 + 5;

    // The data for the pie chart
    double[] data = {25, 18, 15, 12, 8, 30, 35};

    // The labels for the pie chart
    String[] labels = {"Labor", "Licenses", "Taxes", "Legal", "Insurance", "Facilities",
        "Production"};

    // Create a PieChart object of size 100 x 110 pixels
    PieChart c = new PieChart(100, 110);

    // Set the center of the pie at (50, 55) and the radius to 38 pixels
    c.setPieSize(50, 55, 38);

    // Set the depth of the 3D pie
    c.set3D(depth);

    // Add a title showing the depth
    c.addTitle("Depth = " + depth + " pixels", "Arial", 8);

    // Set the pie data
    c.setData(data, labels);

    // Disable the sector labels by setting the color to Transparent
    c.setLabelStyle("", 8, Chart.Transparent);

    // Output the chart
    viewer.setChart(c, Chart.SVG);

    // Include tool tip for the chart
    viewer.setImageMap(c.getHTMLImageMap("", "", "title='{label}: US${value}K ({percent}%)'"));
}
%>
<%
// This example includes 5 charts
WebChartViewer[] viewers = new WebChartViewer[5];
for (int i = 0; i < viewers.length; ++i) {
    viewers[i] = new WebChartViewer(request, "chart" + i);
    createChart(viewers[i], i);
}
%>
<!DOCTYPE html>
<html>
<head>
    <title>3D Depth</title>
    <!-- Include ChartDirector Javascript Library to support chart interactions -->
    <script type="text/javascript" src="cdjcv.js"></script>
</head>
<body style="margin:5px 0px 0px 5px">
    <div style="font:bold 18pt verdana;">
        3D Depth
    </div>
    <hr style="border:solid 1px #000080; background:#000080" />
    <div style="font:10pt verdana; margin-bottom:1.5em">
        <a href="viewsource.jsp?file=<%=request.getServletPath()%>">View Source Code</a>
    </div>
    <!-- ****** Here are the chart images ****** -->
    <%
        for (int i = 0; i < viewers.length; ++i) {
            out.write(viewers[i].renderHTML(response));
            out.write(" ");
        }
    %>
</body>
</html>