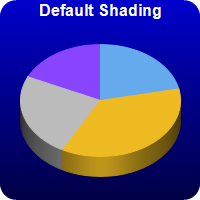
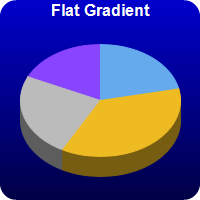
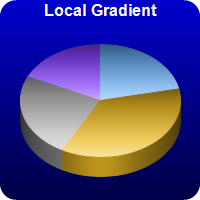
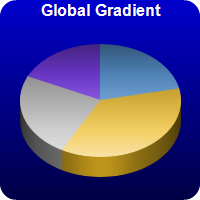
This example demonstrates various sector shading effects applicable to 3D pie charts.
ChartDirector 7.0 (Java Edition)
3D Pie Shading
Source Code Listing
<%@page import="ChartDirector.*, java.util.*" %>
<%!
// Function to create the demo charts
void createChart(WebChartViewer viewer, int chartIndex)
{
// The data for the pie chart
double[] data = {18, 30, 20, 15};
// The labels for the pie chart
String[] labels = {"Labor", "Licenses", "Facilities", "Production"};
// The colors to use for the sectors
int[] colors = {0x66aaee, 0xeebb22, 0xbbbbbb, 0x8844ff};
// Create a PieChart object of size 200 x 200 pixels. Use a vertical gradient color from blue
// (0000cc) to deep blue (000044) as background. Use rounded corners of 16 pixels radius.
PieChart c = new PieChart(200, 200);
c.setBackground(c.linearGradientColor(0, 0, 0, c.getHeight(), 0x0000cc, 0x000044));
c.setRoundedFrame(0xffffff, 16);
// Set the center of the pie at (100, 100) and the radius to 80 pixels
c.setPieSize(100, 100, 80);
// Set the pie data
c.setData(data, labels);
// Set the sector colors
c.setColors2(Chart.DataColor, colors);
// Draw the pie in 3D with a pie thickness of 20 pixels
c.set3D(20);
// Demonstrates various shading modes
if (chartIndex == 0) {
c.addTitle("Default Shading", "bold", 12, 0xffffff);
} else if (chartIndex == 1) {
c.addTitle("Flat Gradient", "bold", 12, 0xffffff);
c.setSectorStyle(Chart.FlatShading);
} else if (chartIndex == 2) {
c.addTitle("Local Gradient", "bold", 12, 0xffffff);
c.setSectorStyle(Chart.LocalGradientShading);
} else if (chartIndex == 3) {
c.addTitle("Global Gradient", "bold", 12, 0xffffff);
c.setSectorStyle(Chart.GlobalGradientShading);
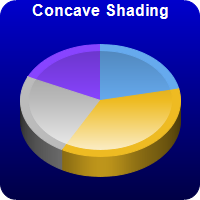
} else if (chartIndex == 4) {
c.addTitle("Concave Shading", "bold", 12, 0xffffff);
c.setSectorStyle(Chart.ConcaveShading);
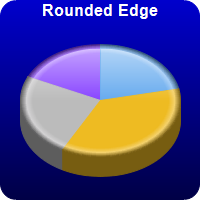
} else if (chartIndex == 5) {
c.addTitle("Rounded Edge", "bold", 12, 0xffffff);
c.setSectorStyle(Chart.RoundedEdgeShading);
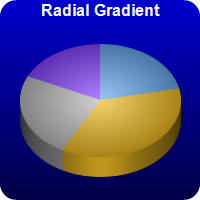
} else if (chartIndex == 6) {
c.addTitle("Radial Gradient", "bold", 12, 0xffffff);
c.setSectorStyle(Chart.RadialShading);
}
// Disable the sector labels by setting the color to Transparent
c.setLabelStyle("", 8, Chart.Transparent);
// Output the chart
viewer.setChart(c, Chart.SVG);
// Include tool tip for the chart
viewer.setImageMap(c.getHTMLImageMap("", "", "title='{label}: US${value}K ({percent}%)'"));
}
%>
<%
// This example includes 7 charts
WebChartViewer[] viewers = new WebChartViewer[7];
for (int i = 0; i < viewers.length; ++i) {
viewers[i] = new WebChartViewer(request, "chart" + i);
createChart(viewers[i], i);
}
%>
<!DOCTYPE html>
<html>
<head>
<title>3D Pie Shading</title>
<!-- Include ChartDirector Javascript Library to support chart interactions -->
<script type="text/javascript" src="cdjcv.js"></script>
</head>
<body style="margin:5px 0px 0px 5px">
<div style="font:bold 18pt verdana;">
3D Pie Shading
</div>
<hr style="border:solid 1px #000080; background:#000080" />
<div style="font:10pt verdana; margin-bottom:1.5em">
<a href="viewsource.jsp?file=<%=request.getServletPath()%>">View Source Code</a>
</div>
<!-- ****** Here are the chart images ****** -->
<%
for (int i = 0; i < viewers.length; ++i) {
out.write(viewers[i].renderHTML(response));
out.write(" ");
}
%>
</body>
</html>