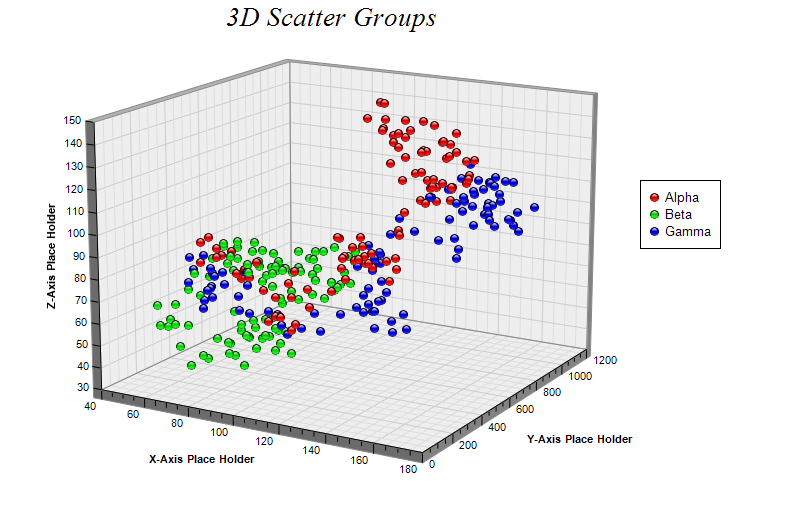
This example demonstrates multiple symbol groups by calling ThreeDScatterChart.addScatterGroup multiple times with different data and colors.
ChartDirector 7.0 (Java Edition)
3D Scatter Groups
Source Code Listing
<%@page import="ChartDirector.*, java.util.*" %>
<%
// The random XYZ data for the first 3D scatter group
RanSeries r0 = new RanSeries(7);
double[] xData0 = r0.getSeries2(100, 100, -10, 10);
double[] yData0 = r0.getSeries2(100, 0, 0, 20);
double[] zData0 = r0.getSeries2(100, 100, -10, 10);

// The random XYZ data for the second 3D scatter group
RanSeries r1 = new RanSeries(4);
double[] xData1 = r1.getSeries2(100, 100, -10, 10);
double[] yData1 = r1.getSeries2(100, 0, 0, 20);
double[] zData1 = r1.getSeries2(100, 100, -10, 10);

// The random XYZ data for the third 3D scatter group
RanSeries r2 = new RanSeries(8);
double[] xData2 = r2.getSeries2(100, 100, -10, 10);
double[] yData2 = r2.getSeries2(100, 0, 0, 20);
double[] zData2 = r2.getSeries2(100, 100, -10, 10);

// Create a ThreeDScatterChart object of size 800 x 520 pixels
ThreeDScatterChart c = new ThreeDScatterChart(800, 520);

// Add a title to the chart using 20 points Times New Roman Italic font
c.addTitle("3D Scatter Groups                    ", "Times New Roman Italic", 20);

// Set the center of the plot region at (350, 240), and set width x depth x height to 360 x 360 x
// 270 pixels
c.setPlotRegion(350, 240, 360, 360, 270);

// Set the elevation and rotation angles to 15 and 30 degrees
c.setViewAngle(15, 30);

// Add a legend box at (640, 180)
c.addLegend(640, 180);

// Add 3 scatter groups to the chart with 9 pixels glass sphere symbols of red (ff0000), green
// (00ff00) and blue (0000ff) colors
c.addScatterGroup(xData0, yData0, zData0, "Alpha", Chart.GlassSphere2Shape, 9, 0xff0000);
c.addScatterGroup(xData1, yData1, zData1, "Beta", Chart.GlassSphere2Shape, 9, 0x00ff00);
c.addScatterGroup(xData2, yData2, zData2, "Gamma", Chart.GlassSphere2Shape, 9, 0x0000ff);

// Set the x, y and z axis titles
c.xAxis().setTitle("X-Axis Place Holder");
c.yAxis().setTitle("Y-Axis Place Holder");
c.zAxis().setTitle("Z-Axis Place Holder");

// Output the chart
WebChartViewer viewer = new WebChartViewer(request, "chart1");
viewer.setChart(c, Chart.SVG);

// Include tool tip for the chart
viewer.setImageMap(c.getHTMLImageMap("", "",
    "title='<*cdml*><*b*><*u*>{dataSetName}<*/u*><*/b*><*br*>X={x|p}<*br*>Y={y|p}<*br*>Z={z|p}'"));
%>
<!DOCTYPE html>
<html>
<head>
    <title>3D Scatter Groups</title>
    <!-- Include ChartDirector Javascript Library to support chart interactions -->
    <script type="text/javascript" src="cdjcv.js"></script>
</head>
<body style="margin:5px 0px 0px 5px">
    <div style="font:bold 18pt verdana;">
        3D Scatter Groups
    </div>
    <hr style="border:solid 1px #000080; background:#000080" />
    <div style="font:10pt verdana; margin-bottom:1.5em">
        <a href="viewsource.jsp?file=<%=request.getServletPath()%>">View Source Code</a>
    </div>
    <!-- ****** Here is the chart image ****** -->
    <%= viewer.renderHTML(response) %>
</body>
</html>