[JSP Version] jspdemo/threedstackarea.jsp
<%@page import="ChartDirector.*, java.util.*" %>
<%
// The data for the area chart
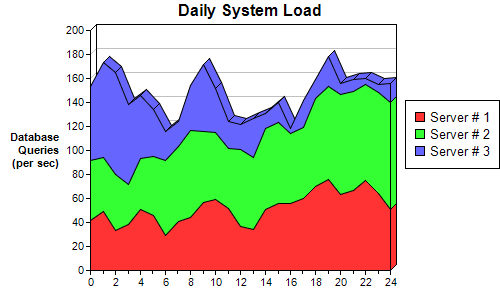
double[] data0 = {42, 49, 33, 38, 51, 46, 29, 41, 44, 57, 59, 52, 37, 34, 51, 56, 56, 60, 70, 76,
63, 67, 75, 64, 51};
double[] data1 = {50, 45, 47, 34, 42, 49, 63, 62, 73, 59, 56, 50, 64, 60, 67, 67, 58, 59, 73, 77,
84, 82, 80, 84, 89};
double[] data2 = {61, 79, 85, 66, 53, 39, 24, 21, 37, 56, 37, 22, 21, 33, 13, 17, 4, 23, 16, 25, 9,
10, 5, 7, 16};
String[] labels = {"0", "1", "2", "3", "4", "5", "6", "7", "8", "9", "10", "11", "12", "13", "14",
"15", "16", "17", "18", "19", "20", "21", "22", "23", "24"};
// Create a XYChart object of size 500 x 300 pixels
XYChart c = new XYChart(500, 300);
// Set the plotarea at (90, 30) and of size 300 x 240 pixels.
c.setPlotArea(90, 30, 300, 240);
// Add a legend box at (405, 100)
c.addLegend(405, 100);
// Add a title to the chart
c.addTitle("Daily System Load");
// Add a title to the y axis. Draw the title upright (font angle = 0)
c.yAxis().setTitle("Database\nQueries\n(per sec)").setFontAngle(0);
// Set the labels on the x axis.
c.xAxis().setLabels(labels);
// Display 1 out of 2 labels on the x-axis. Show minor ticks for remaining labels.
c.xAxis().setLabelStep(2, 1);
// Add an area layer
AreaLayer layer = c.addAreaLayer();
// Draw the area layer in 3D
layer.set3D();
// Add the three data sets to the area layer
layer.addDataSet(data0, -1, "Server # 1");
layer.addDataSet(data1, -1, "Server # 2");
layer.addDataSet(data2, -1, "Server # 3");
// Output the chart
WebChartViewer viewer = new WebChartViewer(request, "chart1");
viewer.setChart(c, Chart.SVG);
// Include tool tip for the chart
viewer.setImageMap(c.getHTMLImageMap("", "",
"title='{dataSetName} load at hour {xLabel}: {value} queries/sec'"));
%>
<!DOCTYPE html>
<html>
<head>
<title>3D Stacked Area Chart</title>
<!-- Include ChartDirector Javascript Library to support chart interactions -->
<script type="text/javascript" src="cdjcv.js"></script>
</head>
<body style="margin:5px 0px 0px 5px">
<div style="font:bold 18pt verdana;">
3D Stacked Area Chart
</div>
<hr style="border:solid 1px #000080; background:#000080" />
<div style="font:10pt verdana; margin-bottom:1.5em">
<a href="viewsource.jsp?file=<%=request.getServletPath()%>">View Source Code</a>
</div>
<!-- ****** Here is the chart image ****** -->
<%= viewer.renderHTML(response) %>
</body>
</html>
© 2021 Advanced Software Engineering Limited. All rights reserved.