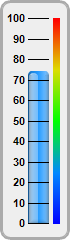
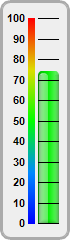
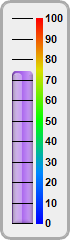
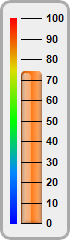
This example demonstration various orientations for vertical bar meters.
In a vertical bar meter, the scale labels can be positioned on the left or right side of the meter scale. This is controlled by the last argument to
LinearMeter.setMeter, which can be
Left or
Right. The color scale can also be position on the same or opposite side as the scale labels.
[JSP Version] jspdemo/vbarmeterorientation.jsp
<%@page import="ChartDirector.*, java.util.*" %>
<%!
// Function to create the demo charts
void createChart(WebChartViewer viewer, int chartIndex)
{
    // The value to display on the meter
    double value = 74.25;

    // Bar colors of the meters
    int[] barColor = {0x2299ff, 0x00ee00, 0xaa66ee, 0xff7711};

    // Create a LinearMeter object of size 70 x 240 pixels with very light grey (0xeeeeee)
    // backgruond and a grey (0xaaaaaa) 3-pixel thick rounded frame
    LinearMeter m = new LinearMeter(70, 240, 0xeeeeee, 0xaaaaaa);
    m.setRoundedFrame(Chart.Transparent);
    m.setThickFrame(3);

    // This example demonstrates putting the text labels at the left or right side of the meter
    // scale, and putting the color scale on the same side as the labels or on opposite side.
    int[] alignment = {Chart.Left, Chart.Left, Chart.Right, Chart.Right};
    int[] meterXPos = {28, 38, 12, 21};
    int[] labelGap = {2, 12, 10, 2};
    int[] colorScalePos = {53, 28, 36, 10};

    // Configure the position of the meter scale and which side to put the text labels
    m.setMeter(meterXPos[chartIndex], 18, 20, 205, alignment[chartIndex]);

    // Set meter scale from 0 - 100, with a tick every 10 units
    m.setScale(0, 100, 10);

    // To put the color scale on the same side as the text labels, we need to increase the gap
    // between the labels and the meter scale to make room for the color scale
    m.setLabelPos(false, labelGap[chartIndex]);

    // Add a smooth color scale to the meter
    double[] smoothColorScale = {0, 0x0000ff, 25, 0x0088ff, 50, 0x00ff00, 75, 0xdddd00, 100,
        0xff0000};
    m.addColorScale(smoothColorScale, colorScalePos[chartIndex], 6);

    // Add a bar from 0 to value with glass effect and 4 pixel rounded corners
    m.addBar(0, value, barColor[chartIndex], Chart.glassEffect(Chart.NormalGlare, Chart.Left), 4);

    // Output the chart
    viewer.setChart(m, Chart.SVG);
}
%>
<%
// This example includes 4 charts
WebChartViewer[] viewers = new WebChartViewer[4];
for (int i = 0; i < viewers.length; ++i) {
    viewers[i] = new WebChartViewer(request, "chart" + i);
    createChart(viewers[i], i);
}
%>
<!DOCTYPE html>
<html>
<head>
    <title>V-Bar Meter Orientation</title>
    <!-- Include ChartDirector Javascript Library to support chart interactions -->
    <script type="text/javascript" src="cdjcv.js"></script>
</head>
<body style="margin:5px 0px 0px 5px">
    <div style="font:bold 18pt verdana;">
        V-Bar Meter Orientation
    </div>
    <hr style="border:solid 1px #000080; background:#000080" />
    <div style="font:10pt verdana; margin-bottom:1.5em">
        <a href="viewsource.jsp?file=<%=request.getServletPath()%>">View Source Code</a>
    </div>
    <!-- ****** Here are the chart images ****** -->
    <%
        for (int i = 0; i < viewers.length; ++i) {
            out.write(viewers[i].renderHTML(response));
            out.write(" ");
        }
    %>
</body>
</html>
© 2021 Advanced Software Engineering Limited. All rights reserved.