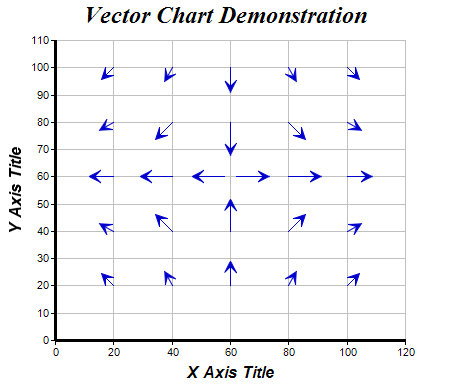
This example demonstrates a vector chart.
A vector chart is like a scatter chart, but the symbols are arrows which can be of arbitrary lengths pointing to arbitrary directions. Thus each symbol in a vector chart is specified by 4 values - the x and y coordinates, the length and the direction.
In ChartDirector, an XY vector layer is created using
XYChart.addVectorLayer.
[JSP Version] jspdemo/vector.jsp
<%@page import="ChartDirector.*, java.util.*" %>
<%
// The (x, y) coordinates of the starting point of the vectors
double[] dataX = {20, 40, 60, 80, 100, 20, 40, 60, 80, 100, 20, 40, 58, 62, 80, 100, 20, 40, 60, 80,
    100, 20, 40, 60, 80, 100};
double[] dataY = {20, 20, 20, 20, 20, 40, 40, 40, 40, 40, 60, 60, 60, 60, 60, 60, 80, 80, 80, 80,
    80, 100, 100, 100, 100, 100};

// The lengths (radii) and directions (angles) of the vectors
double[] dataR = {6, 6, 9, 6, 6, 6, 9, 12, 9, 6, 9, 12, 12, 12, 12, 9, 6, 9, 12, 9, 6, 6, 6, 9, 6, 6
    };
double[] dataA = {-45, -30, 0, 30, 45, -60, -45, 0, 45, 60, -90, -90, -90, 90, 90, 90, -120, -135,
    180, 135, 120, -135, -150, 180, 150, 135};

// Create a XYChart object of size 450 x 390 pixels
XYChart c = new XYChart(450, 390);

// Set the plotarea at (55, 40) and of size 350 x 300 pixels, with a light grey border (0xc0c0c0).
// Turn on both horizontal and vertical grid lines with light grey color (0xc0c0c0)
c.setPlotArea(55, 40, 350, 300, -1, -1, 0xc0c0c0, 0xc0c0c0, -1);

// Add a title to the chart using 18pt Times Bold Itatic font.
c.addTitle("Vector Chart Demonstration", "Times New Roman Bold Italic", 18);

// Add a title to the y axis using 12pt Arial Bold Italic font
c.yAxis().setTitle("Y Axis Title", "Arial Bold Italic", 12);

// Add a title to the x axis using 12pt Arial Bold Italic font
c.xAxis().setTitle("X Axis Title", "Arial Bold Italic", 12);

// Set the axes line width to 3 pixels
c.xAxis().setWidth(3);
c.yAxis().setWidth(3);

// Add a vector layer to the chart using blue (0000CC) color, with vector arrow size set to 11
// pixels
c.addVectorLayer(dataX, dataY, dataR, dataA, Chart.YAxisScale, 0x0000cc).setArrowHead(11);

// Output the chart
WebChartViewer viewer = new WebChartViewer(request, "chart1");
viewer.setChart(c, Chart.SVG);

// Include tool tip for the chart
viewer.setImageMap(c.getHTMLImageMap("", "",
    "title='Vector at ({x}, {value}): Length = {len}, Angle = {dir} deg'"));
%>
<!DOCTYPE html>
<html>
<head>
    <title>Vector Chart</title>
    <!-- Include ChartDirector Javascript Library to support chart interactions -->
    <script type="text/javascript" src="cdjcv.js"></script>
</head>
<body style="margin:5px 0px 0px 5px">
    <div style="font:bold 18pt verdana;">
        Vector Chart
    </div>
    <hr style="border:solid 1px #000080; background:#000080" />
    <div style="font:10pt verdana; margin-bottom:1.5em">
        <a href="viewsource.jsp?file=<%=request.getServletPath()%>">View Source Code</a>
    </div>
    <!-- ****** Here is the chart image ****** -->
    <%= viewer.renderHTML(response) %>
</body>
</html>
© 2021 Advanced Software Engineering Limited. All rights reserved.