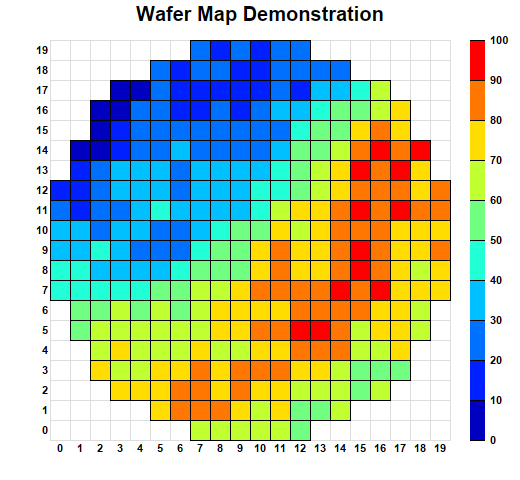
This example demonstrates creating a wafer map.
A wafer map is a discrete heat map with a circular border. (A contour chart can also be used for some applications.) It is called a wafer map because it is frequently used in the semiconductor industry to visualize properties of semiconductor wafers.
This example is similar to
Discrete Heat Map. The circular shape is achieved by setting the cells outside the circle to
NoValue to disable them.
[JSP Version] jspdemo/wafermap.jsp
<%@page import="ChartDirector.*, java.util.*" %>
<%
// The diameter of the wafer
int diameter = 20;
double radius = diameter / 2.0;

// The random data array are for a square grid of 20 x 20 cells
RanSeries r = new RanSeries(2);
double[] zData = r.get2DSeries(diameter, diameter, 0, 100);

// We remove cells that are outside the wafer circle by setting them to NoValue
for(int i = 0; i < zData.length; ++i) {
    double x = i % diameter + 0.5;
    double y = (i - x) / diameter + 0.5;
    if ((x - radius) * (x - radius) + (y - radius) * (y - radius) > radius * radius) {
        zData[i] = Chart.NoValue;
    }
}

// Create an XYChart object of size 520 x 480 pixels.
XYChart c = new XYChart(520, 480);

// Add a title the chart with 15pt Arial Bold font
c.addTitle("Wafer Map Demonstration", "Arial Bold", 15);

// Set the plotarea at (50, 40) and of size 400 x 400 pixels. Set the backgound and border to
// transparent. Set both horizontal and vertical grid lines to light grey. (0xdddddd)
PlotArea p = c.setPlotArea(50, 40, 400, 400, -1, -1, Chart.Transparent, 0xdddddd, 0xdddddd);

// Create a discrete heat map with 20 x 20 cells
DiscreteHeatMapLayer layer = c.addDiscreteHeatMapLayer(zData, diameter);

// Set the x-axis scale. Use 8pt Arial Bold font. Set axis color to transparent, so only the labels
// visible. Set 0.5 offset to position the labels in between the grid lines.
c.xAxis().setLinearScale(0, diameter, 1);
c.xAxis().setLabelStyle("Arial Bold", 8);
c.xAxis().setColors(Chart.Transparent, Chart.TextColor);
c.xAxis().setLabelOffset(0.5);

// Set the y-axis scale. Use 8pt Arial Bold font. Set axis color to transparent, so only the labels
// visible. Set 0.5 offset to position the labels in between the grid lines.
c.yAxis().setLinearScale(0, diameter, 1);
c.yAxis().setLabelStyle("Arial Bold", 8);
c.yAxis().setColors(Chart.Transparent, Chart.TextColor);
c.yAxis().setLabelOffset(0.5);

// Position the color axis 20 pixels to the right of the plot area and of the same height as the
// plot area. Put the labels on the right side of the color axis. Use 8pt Arial Bold font for the
// labels.
ColorAxis cAxis = layer.setColorAxis(p.getRightX() + 20, p.getTopY(), Chart.TopLeft, p.getHeight(),
    Chart.Right);
cAxis.setLabelStyle("Arial Bold", 8);

// Output the chart
WebChartViewer viewer = new WebChartViewer(request, "chart1");
viewer.setChart(c, Chart.SVG);

// Include tool tip for the chart
viewer.setImageMap(c.getHTMLImageMap("", "", "title='<*cdml*>({xLabel}, {yLabel}) = {z|2}'"));
%>
<!DOCTYPE html>
<html>
<head>
    <title>Wafer Map</title>
    <!-- Include ChartDirector Javascript Library to support chart interactions -->
    <script type="text/javascript" src="cdjcv.js"></script>
</head>
<body style="margin:5px 0px 0px 5px">
    <div style="font:bold 18pt verdana;">
        Wafer Map
    </div>
    <hr style="border:solid 1px #000080; background:#000080" />
    <div style="font:10pt verdana; margin-bottom:1.5em">
        <a href="viewsource.jsp?file=<%=request.getServletPath()%>">View Source Code</a>
    </div>
    <!-- ****** Here is the chart image ****** -->
    <%= viewer.renderHTML(response) %>
</body>
</html>
© 2021 Advanced Software Engineering Limited. All rights reserved.