[Windows Forms - C# version] NetWinCharts\CSharpWinCharts\angularpointer.cs
using System;
using ChartDirector;
namespace CSharpChartExplorer
{
public class angularpointer : DemoModule
{
//Name of demo module
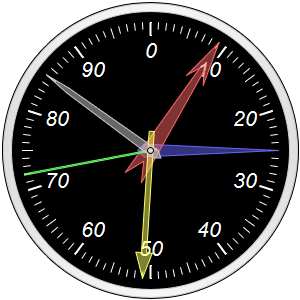
public string getName() { return "Angular Meter Pointers (1)"; }
//Number of charts produced in this demo module
public int getNoOfCharts() { return 1; }
//Main code for creating chart.
//Note: the argument chartIndex is unused because this demo only has 1 chart.
public void createChart(WinChartViewer viewer, int chartIndex)
{
// Create an AngularMeter object of size 300 x 300 pixels with transparent background
AngularMeter m = new AngularMeter(300, 300, Chart.Transparent);
// Set the default text and line colors to white (0xffffff)
m.setColor(Chart.TextColor, 0xffffff);
m.setColor(Chart.LineColor, 0xffffff);
// Center at (150, 150), scale radius = 128 pixels, scale angle 0 to 360 degrees
m.setMeter(150, 150, 128, 0, 360);
// Add a black (0x000000) circle with radius 148 pixels as background
m.addRing(0, 148, 0x000000);
// Add a ring between radii 139 and 147 pixels using the silver color with a light grey
// (0xcccccc) edge as border
m.addRing(139, 147, Chart.silverColor(), 0xcccccc);
// Meter scale is 0 - 100, with major/minor/micro ticks every 10/5/1 units
m.setScale(0, 100, 10, 5, 1);
// Set the scale label style to 16pt Arial Italic. Set the major/minor/micro tick
// lengths to 13/10/7 pixels pointing inwards, and their widths to 2/1/1 pixels.
m.setLabelStyle("Arial Italic", 16);
m.setTickLength(-13, -10, -7);
m.setLineWidth(0, 2, 1, 1);
// Add a semi-transparent blue (0x7f6666ff) pointer using the default shape
m.addPointer(25, 0x7f6666ff, 0x6666ff);
// Add a semi-transparent red (0x7fff6666) pointer using the arrow shape
m.addPointer(9, 0x7fff6666, 0xff6666).setShape(Chart.ArrowPointer2);
// Add a semi-transparent yellow (0x7fffff66) pointer using another arrow shape
m.addPointer(51, 0x7fffff66, 0xffff66).setShape(Chart.ArrowPointer);
// Add a semi-transparent green (0x7f66ff66) pointer using the line shape
m.addPointer(72, 0x7f66ff66, 0x66ff66).setShape(Chart.LinePointer);
// Add a semi-transparent grey (0x7fcccccc) pointer using the pencil shape
m.addPointer(85, 0x7fcccccc, 0xcccccc).setShape(Chart.PencilPointer);
// Output the chart
viewer.Chart = m;
}
}
}
[Windows Forms - VB Version] NetWinCharts\VBNetWinCharts\angularpointer.vb
Imports System
Imports Microsoft.VisualBasic
Imports ChartDirector

Public Class angularpointer
    Implements DemoModule

    'Name of demo module
    Public Function getName() As String Implements DemoModule.getName
        Return "Angular Meter Pointers (1)"
    End Function

    'Number of charts produced in this demo module
    Public Function getNoOfCharts() As Integer Implements DemoModule.getNoOfCharts
        Return 1
    End Function

    'Main code for creating chart.
    'Note: the argument chartIndex is unused because this demo only has 1 chart.
    Public Sub createChart(viewer As WinChartViewer, chartIndex As Integer) _
        Implements DemoModule.createChart

        ' Create an AngularMeter object of size 300 x 300 pixels with transparent background
        Dim m As AngularMeter = New AngularMeter(300, 300, Chart.Transparent)

        ' Set the default text and line colors to white (0xffffff)
        m.setColor(Chart.TextColor, &Hffffff)
        m.setColor(Chart.LineColor, &Hffffff)

        ' Center at (150, 150), scale radius = 128 pixels, scale angle 0 to 360 degrees
        m.setMeter(150, 150, 128, 0, 360)

        ' Add a black (0x000000) circle with radius 148 pixels as background
        m.addRing(0, 148, &H000000)

        ' Add a ring between radii 139 and 147 pixels using the silver color with a light grey
        ' (0xcccccc) edge as border
        m.addRing(139, 147, Chart.silverColor(), &Hcccccc)

        ' Meter scale is 0 - 100, with major/minor/micro ticks every 10/5/1 units
        m.setScale(0, 100, 10, 5, 1)

        ' Set the scale label style to 16pt Arial Italic. Set the major/minor/micro tick lengths to
        ' 13/10/7 pixels pointing inwards, and their widths to 2/1/1 pixels.
        m.setLabelStyle("Arial Italic", 16)
        m.setTickLength(-13, -10, -7)
        m.setLineWidth(0, 2, 1, 1)

        ' Add a semi-transparent blue (0x7f6666ff) pointer using the default shape
        m.addPointer(25, &H7f6666ff, &H6666ff)

        ' Add a semi-transparent red (0x7fff6666) pointer using the arrow shape
        m.addPointer(9, &H7fff6666, &Hff6666).setShape(Chart.ArrowPointer2)

        ' Add a semi-transparent yellow (0x7fffff66) pointer using another arrow shape
        m.addPointer(51, &H7fffff66, &Hffff66).setShape(Chart.ArrowPointer)

        ' Add a semi-transparent green (0x7f66ff66) pointer using the line shape
        m.addPointer(72, &H7f66ff66, &H66ff66).setShape(Chart.LinePointer)

        ' Add a semi-transparent grey (0x7fcccccc) pointer using the pencil shape
        m.addPointer(85, &H7fcccccc, &Hcccccc).setShape(Chart.PencilPointer)

        ' Output the chart
        viewer.Chart = m

    End Sub

End Class
[WPF - C#] NetWPFCharts\CSharpWPFCharts\angularpointer.cs
using System;
using ChartDirector;

namespace CSharpWPFCharts
{
    public class angularpointer : DemoModule
    {
        //Name of demo module
        public string getName() { return "Angular Meter Pointers (1)"; }

        //Number of charts produced in this demo module
        public int getNoOfCharts() { return 1; }

        //Main code for creating chart.
        //Note: the argument chartIndex is unused because this demo only has 1 chart.
        public void createChart(WPFChartViewer viewer, int chartIndex)
        {
            // Create an AngularMeter object of size 300 x 300 pixels with transparent background
            AngularMeter m = new AngularMeter(300, 300, Chart.Transparent);

            // Set the default text and line colors to white (0xffffff)
            m.setColor(Chart.TextColor, 0xffffff);
            m.setColor(Chart.LineColor, 0xffffff);

            // Center at (150, 150), scale radius = 128 pixels, scale angle 0 to 360 degrees
            m.setMeter(150, 150, 128, 0, 360);

            // Add a black (0x000000) circle with radius 148 pixels as background
            m.addRing(0, 148, 0x000000);

            // Add a ring between radii 139 and 147 pixels using the silver color with a light grey
            // (0xcccccc) edge as border
            m.addRing(139, 147, Chart.silverColor(), 0xcccccc);

            // Meter scale is 0 - 100, with major/minor/micro ticks every 10/5/1 units
            m.setScale(0, 100, 10, 5, 1);

            // Set the scale label style to 16pt Arial Italic. Set the major/minor/micro tick
            // lengths to 13/10/7 pixels pointing inwards, and their widths to 2/1/1 pixels.
            m.setLabelStyle("Arial Italic", 16);
            m.setTickLength(-13, -10, -7);
            m.setLineWidth(0, 2, 1, 1);

            // Add a semi-transparent blue (0x7f6666ff) pointer using the default shape
            m.addPointer(25, 0x7f6666ff, 0x6666ff);

            // Add a semi-transparent red (0x7fff6666) pointer using the arrow shape
            m.addPointer(9, 0x7fff6666, 0xff6666).setShape(Chart.ArrowPointer2);

            // Add a semi-transparent yellow (0x7fffff66) pointer using another arrow shape
            m.addPointer(51, 0x7fffff66, 0xffff66).setShape(Chart.ArrowPointer);

            // Add a semi-transparent green (0x7f66ff66) pointer using the line shape
            m.addPointer(72, 0x7f66ff66, 0x66ff66).setShape(Chart.LinePointer);

            // Add a semi-transparent grey (0x7fcccccc) pointer using the pencil shape
            m.addPointer(85, 0x7fcccccc, 0xcccccc).setShape(Chart.PencilPointer);

            // Output the chart
            viewer.Chart = m;
        }
    }
}
[ASP.NET Web Forms - C# version] NetWebCharts\CSharpASP\angularpointer.aspx
(Click here on how to convert this code to code-behind style.)<%@ Page Language="C#" Debug="true" %>
<%@ Import Namespace="ChartDirector" %>
<%@ Register TagPrefix="chart" Namespace="ChartDirector" Assembly="netchartdir" %>
<!DOCTYPE html>
<script runat="server">
//
// Page Load event handler
//
protected void Page_Load(object sender, EventArgs e)
{
// Create an AngularMeter object of size 300 x 300 pixels with transparent background
AngularMeter m = new AngularMeter(300, 300, Chart.Transparent);
// Set the default text and line colors to white (0xffffff)
m.setColor(Chart.TextColor, 0xffffff);
m.setColor(Chart.LineColor, 0xffffff);
// Center at (150, 150), scale radius = 128 pixels, scale angle 0 to 360 degrees
m.setMeter(150, 150, 128, 0, 360);
// Add a black (0x000000) circle with radius 148 pixels as background
m.addRing(0, 148, 0x000000);
// Add a ring between radii 139 and 147 pixels using the silver color with a light grey
// (0xcccccc) edge as border
m.addRing(139, 147, Chart.silverColor(), 0xcccccc);
// Meter scale is 0 - 100, with major/minor/micro ticks every 10/5/1 units
m.setScale(0, 100, 10, 5, 1);
// Set the scale label style to 16pt Arial Italic. Set the major/minor/micro tick lengths to
// 13/10/7 pixels pointing inwards, and their widths to 2/1/1 pixels.
m.setLabelStyle("Arial Italic", 16);
m.setTickLength(-13, -10, -7);
m.setLineWidth(0, 2, 1, 1);
// Add a semi-transparent blue (0x7f6666ff) pointer using the default shape
m.addPointer(25, 0x7f6666ff, 0x6666ff);
// Add a semi-transparent red (0x7fff6666) pointer using the arrow shape
m.addPointer(9, 0x7fff6666, 0xff6666).setShape(Chart.ArrowPointer2);
// Add a semi-transparent yellow (0x7fffff66) pointer using another arrow shape
m.addPointer(51, 0x7fffff66, 0xffff66).setShape(Chart.ArrowPointer);
// Add a semi-transparent green (0x7f66ff66) pointer using the line shape
m.addPointer(72, 0x7f66ff66, 0x66ff66).setShape(Chart.LinePointer);
// Add a semi-transparent grey (0x7fcccccc) pointer using the pencil shape
m.addPointer(85, 0x7fcccccc, 0xcccccc).setShape(Chart.PencilPointer);
// Output the chart
WebChartViewer1.Image = m.makeWebImage(Chart.SVG);
}
</script>
<html>
<head>
<script type="text/javascript" src="cdjcv.js"></script>
</head>
<body>
<chart:WebChartViewer id="WebChartViewer1" runat="server" />
</body>
</html>
[ASP.NET Web Forms - VB Version] NetWebCharts\VBNetASP\angularpointer.aspx
(Click here on how to convert this code to code-behind style.)<%@ Page Language="VB" Debug="true" %>
<%@ Import Namespace="ChartDirector" %>
<%@ Register TagPrefix="chart" Namespace="ChartDirector" Assembly="netchartdir" %>
<!DOCTYPE html>
<script runat="server">
'
' Page Load event handler
'
Protected Sub Page_Load(ByVal sender As System.Object, ByVal e As System.EventArgs)
' Create an AngularMeter object of size 300 x 300 pixels with transparent background
Dim m As AngularMeter = New AngularMeter(300, 300, Chart.Transparent)
' Set the default text and line colors to white (0xffffff)
m.setColor(Chart.TextColor, &Hffffff)
m.setColor(Chart.LineColor, &Hffffff)
' Center at (150, 150), scale radius = 128 pixels, scale angle 0 to 360 degrees
m.setMeter(150, 150, 128, 0, 360)
' Add a black (0x000000) circle with radius 148 pixels as background
m.addRing(0, 148, &H000000)
' Add a ring between radii 139 and 147 pixels using the silver color with a light grey
' (0xcccccc) edge as border
m.addRing(139, 147, Chart.silverColor(), &Hcccccc)
' Meter scale is 0 - 100, with major/minor/micro ticks every 10/5/1 units
m.setScale(0, 100, 10, 5, 1)
' Set the scale label style to 16pt Arial Italic. Set the major/minor/micro tick lengths to
' 13/10/7 pixels pointing inwards, and their widths to 2/1/1 pixels.
m.setLabelStyle("Arial Italic", 16)
m.setTickLength(-13, -10, -7)
m.setLineWidth(0, 2, 1, 1)
' Add a semi-transparent blue (0x7f6666ff) pointer using the default shape
m.addPointer(25, &H7f6666ff, &H6666ff)
' Add a semi-transparent red (0x7fff6666) pointer using the arrow shape
m.addPointer(9, &H7fff6666, &Hff6666).setShape(Chart.ArrowPointer2)
' Add a semi-transparent yellow (0x7fffff66) pointer using another arrow shape
m.addPointer(51, &H7fffff66, &Hffff66).setShape(Chart.ArrowPointer)
' Add a semi-transparent green (0x7f66ff66) pointer using the line shape
m.addPointer(72, &H7f66ff66, &H66ff66).setShape(Chart.LinePointer)
' Add a semi-transparent grey (0x7fcccccc) pointer using the pencil shape
m.addPointer(85, &H7fcccccc, &Hcccccc).setShape(Chart.PencilPointer)
' Output the chart
WebChartViewer1.Image = m.makeWebImage(Chart.SVG)
End Sub
</script>
<html>
<head>
<script type="text/javascript" src="cdjcv.js"></script>
</head>
<body>
<chart:WebChartViewer id="WebChartViewer1" runat="server" />
</body>
</html>
[ASP.NET MVC - Controller] NetMvcCharts\Controllers\AngularpointerController.cs
using System;
using System.Web.Mvc;
using ChartDirector;

namespace NetMvcCharts.Controllers
{
    public class AngularpointerController : Controller
    {
        //
        // Default Action
        //
        public ActionResult Index()
        {
            ViewBag.Title = "Angular Meter Pointers (1)";
            createChart(ViewBag.Viewer = new RazorChartViewer(HttpContext, "chart1"));
            return View("~/Views/Shared/ChartView.cshtml");
        }

        //
        // Create chart
        //
        private void createChart(RazorChartViewer viewer)
        {
            // Create an AngularMeter object of size 300 x 300 pixels with transparent background
            AngularMeter m = new AngularMeter(300, 300, Chart.Transparent);

            // Set the default text and line colors to white (0xffffff)
            m.setColor(Chart.TextColor, 0xffffff);
            m.setColor(Chart.LineColor, 0xffffff);

            // Center at (150, 150), scale radius = 128 pixels, scale angle 0 to 360 degrees
            m.setMeter(150, 150, 128, 0, 360);

            // Add a black (0x000000) circle with radius 148 pixels as background
            m.addRing(0, 148, 0x000000);

            // Add a ring between radii 139 and 147 pixels using the silver color with a light grey
            // (0xcccccc) edge as border
            m.addRing(139, 147, Chart.silverColor(), 0xcccccc);

            // Meter scale is 0 - 100, with major/minor/micro ticks every 10/5/1 units
            m.setScale(0, 100, 10, 5, 1);

            // Set the scale label style to 16pt Arial Italic. Set the major/minor/micro tick lengths to
            // 13/10/7 pixels pointing inwards, and their widths to 2/1/1 pixels.
            m.setLabelStyle("Arial Italic", 16);
            m.setTickLength(-13, -10, -7);
            m.setLineWidth(0, 2, 1, 1);

            // Add a semi-transparent blue (0x7f6666ff) pointer using the default shape
            m.addPointer(25, 0x7f6666ff, 0x6666ff);

            // Add a semi-transparent red (0x7fff6666) pointer using the arrow shape
            m.addPointer(9, 0x7fff6666, 0xff6666).setShape(Chart.ArrowPointer2);

            // Add a semi-transparent yellow (0x7fffff66) pointer using another arrow shape
            m.addPointer(51, 0x7fffff66, 0xffff66).setShape(Chart.ArrowPointer);

            // Add a semi-transparent green (0x7f66ff66) pointer using the line shape
            m.addPointer(72, 0x7f66ff66, 0x66ff66).setShape(Chart.LinePointer);

            // Add a semi-transparent grey (0x7fcccccc) pointer using the pencil shape
            m.addPointer(85, 0x7fcccccc, 0xcccccc).setShape(Chart.PencilPointer);

            // Output the chart
            viewer.Image = m.makeWebImage(Chart.SVG);
        }
    }
}
[ASP.NET MVC - View] NetMvcCharts\Views\Shared\ChartView.cshtml
@{ Layout = null; }

<!DOCTYPE html>

<html>
<head>
    <meta name="viewport" content="width=device-width" />
    <title>@ViewBag.Title</title>
    <style>
        @ViewBag.Style
    </style>
    @Scripts.Render("~/Scripts/cdjcv.js")
</head>
<body style="margin:5px 0px 0px 5px">
    <div style="font:bold 18pt verdana;">
        @ViewBag.Title
    </div>
    <hr style="border:solid 1px #000080; background:#000080" />
    <div>
        @{
            if (ViewBag.Viewer is Array)
            {
                // Display multiple charts
                for (int i = 0; i < ViewBag.Viewer.Length; ++i)
                {
                    @:@Html.Raw(ViewBag.Viewer[i].RenderHTML())
                }
            }
            else
            {
                // Display one chart only
                @:@Html.Raw(ViewBag.Viewer.RenderHTML())
            }
        }
    </div>
</body>
</html>
© 2023 Advanced Software Engineering Limited. All rights reserved.