[Windows Forms - C# version] NetWinCharts\CSharpWinCharts\background.cs
using System;
using ChartDirector;
namespace CSharpChartExplorer
{
public class background : DemoModule
{
//Name of demo module
public string getName() { return "Background and Wallpaper"; }
//Number of charts produced in this demo module
public int getNoOfCharts() { return 4; }
//Main code for creating charts
public void createChart(WinChartViewer viewer, int chartIndex)
{
// The data for the chart
double[] data = {85, 156, 179.5, 211, 123};
string[] labels = {"Mon", "Tue", "Wed", "Thu", "Fri"};
// Create a XYChart object of size 270 x 270 pixels
XYChart c = new XYChart(270, 270);
// Set the plot area at (40, 32) and of size 200 x 200 pixels
PlotArea plotarea = c.setPlotArea(40, 32, 200, 200);
// Set the background style based on the input parameter
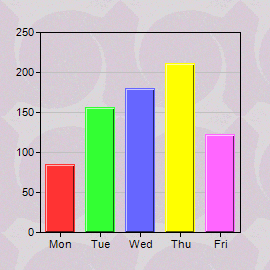
if (chartIndex == 0) {
// Has wallpaper image
c.setWallpaper("@/images/tile.png");
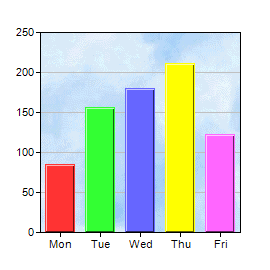
} else if (chartIndex == 1) {
// Use a background image as the plot area background
plotarea.setBackground2("@/images/bg.png");
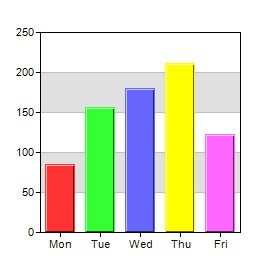
} else if (chartIndex == 2) {
// Use white (0xffffff) and grey (0xe0e0e0) as two alternate plotarea background
// colors
plotarea.setBackground(0xffffff, 0xe0e0e0);
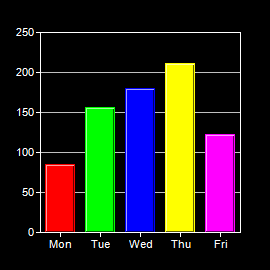
} else {
// Use a dark background palette
c.setColors(Chart.whiteOnBlackPalette);
}
// Set the labels on the x axis
c.xAxis().setLabels(labels);
// Add a color bar layer using the given data. Use a 1 pixel 3D border for the bars.
c.addBarLayer3(data).setBorderColor(-1, 1);
// Output the chart
viewer.Chart = c;
//include tool tip for the chart
viewer.ImageMap = c.getHTMLImageMap("clickable", "",
"title='Revenue for {xLabel}: US${value}K'");
}
}
}
[Windows Forms - VB Version] NetWinCharts\VBNetWinCharts\background.vb
Imports System
Imports Microsoft.VisualBasic
Imports ChartDirector

Public Class background
    Implements DemoModule

    'Name of demo module
    Public Function getName() As String Implements DemoModule.getName
        Return "Background and Wallpaper"
    End Function

    'Number of charts produced in this demo module
    Public Function getNoOfCharts() As Integer Implements DemoModule.getNoOfCharts
        Return 4
    End Function

    'Main code for creating charts
    Public Sub createChart(viewer As WinChartViewer, chartIndex As Integer) _
        Implements DemoModule.createChart

        ' The data for the chart
        Dim data() As Double = {85, 156, 179.5, 211, 123}
        Dim labels() As String = {"Mon", "Tue", "Wed", "Thu", "Fri"}

        ' Create a XYChart object of size 270 x 270 pixels
        Dim c As XYChart = New XYChart(270, 270)

        ' Set the plot area at (40, 32) and of size 200 x 200 pixels
        Dim plotarea As PlotArea = c.setPlotArea(40, 32, 200, 200)

        ' Set the background style based on the input parameter
        If chartIndex = 0 Then
            ' Has wallpaper image
            c.setWallpaper("@/tile.png")
        ElseIf chartIndex = 1 Then
            ' Use a background image as the plot area background
            plotarea.setBackground2("@/bg.png")
        ElseIf chartIndex = 2 Then
            ' Use white (0xffffff) and grey (0xe0e0e0) as two alternate plotarea background colors
            plotarea.setBackground(&Hffffff, &He0e0e0)
        Else
            ' Use a dark background palette
            c.setColors(Chart.whiteOnBlackPalette)
        End If

        ' Set the labels on the x axis
        c.xAxis().setLabels(labels)

        ' Add a color bar layer using the given data. Use a 1 pixel 3D border for the bars.
        c.addBarLayer3(data).setBorderColor(-1, 1)

        ' Output the chart
        viewer.Chart = c

        'include tool tip for the chart
        viewer.ImageMap = c.getHTMLImageMap("clickable", "", _
            "title='Revenue for {xLabel}: US${value}K'")

    End Sub

End Class
[WPF - C#] NetWPFCharts\CSharpWPFCharts\background.cs
using System;
using ChartDirector;

namespace CSharpWPFCharts
{
    public class background : DemoModule
    {
        //Name of demo module
        public string getName() { return "Background and Wallpaper"; }

        //Number of charts produced in this demo module
        public int getNoOfCharts() { return 4; }

        //Main code for creating charts
        public void createChart(WPFChartViewer viewer, int chartIndex)
        {
            // The data for the chart
            double[] data = {85, 156, 179.5, 211, 123};
            string[] labels = {"Mon", "Tue", "Wed", "Thu", "Fri"};

            // Create a XYChart object of size 270 x 270 pixels
            XYChart c = new XYChart(270, 270);

            // Set the plot area at (40, 32) and of size 200 x 200 pixels
            PlotArea plotarea = c.setPlotArea(40, 32, 200, 200);

            // Set the background style based on the input parameter
            if (chartIndex == 0) {
                // Has wallpaper image
                c.setWallpaper("@/images/tile.png");
            } else if (chartIndex == 1) {
                // Use a background image as the plot area background
                plotarea.setBackground2("@/images/bg.png");
            } else if (chartIndex == 2) {
                // Use white (0xffffff) and grey (0xe0e0e0) as two alternate plotarea background
                // colors
                plotarea.setBackground(0xffffff, 0xe0e0e0);
            } else {
                // Use a dark background palette
                c.setColors(Chart.whiteOnBlackPalette);
            }

            // Set the labels on the x axis
            c.xAxis().setLabels(labels);

            // Add a color bar layer using the given data. Use a 1 pixel 3D border for the bars.
            c.addBarLayer3(data).setBorderColor(-1, 1);

            // Output the chart
            viewer.Chart = c;

            //include tool tip for the chart
            viewer.ImageMap = c.getHTMLImageMap("clickable", "",
                "title='Revenue for {xLabel}: US${value}K'");
        }
    }
}
[ASP.NET Web Forms - C# version] NetWebCharts\CSharpASP\background.aspx
(Click here on how to convert this code to code-behind style.)<%@ Page Language="C#" Debug="true" %>
<%@ Import Namespace="ChartDirector" %>
<%@ Register TagPrefix="chart" Namespace="ChartDirector" Assembly="netchartdir" %>
<!DOCTYPE html>
<script runat="server">
//
// Create chart
//
protected void createChart(WebChartViewer viewer, int chartIndex)
{
// The data for the chart
double[] data = {85, 156, 179.5, 211, 123};
string[] labels = {"Mon", "Tue", "Wed", "Thu", "Fri"};
// Create a XYChart object of size 270 x 270 pixels
XYChart c = new XYChart(270, 270);
// Set the plot area at (40, 32) and of size 200 x 200 pixels
PlotArea plotarea = c.setPlotArea(40, 32, 200, 200);
// Set the background style based on the input parameter
if (chartIndex == 0) {
// Has wallpaper image
c.setWallpaper(Server.MapPath("tile.png"));
} else if (chartIndex == 1) {
// Use a background image as the plot area background
plotarea.setBackground2(Server.MapPath("bg.png"));
} else if (chartIndex == 2) {
// Use white (0xffffff) and grey (0xe0e0e0) as two alternate plotarea background colors
plotarea.setBackground(0xffffff, 0xe0e0e0);
} else {
// Use a dark background palette
c.setColors(Chart.whiteOnBlackPalette);
}
// Set the labels on the x axis
c.xAxis().setLabels(labels);
// Add a color bar layer using the given data. Use a 1 pixel 3D border for the bars.
c.addBarLayer3(data).setBorderColor(-1, 1);
// Output the chart
viewer.Image = c.makeWebImage(Chart.SVG);
// Include tool tip for the chart
viewer.ImageMap = c.getHTMLImageMap("", "", "title='Revenue for {xLabel}: US${value}K'");
}
//
// Page Load event handler
//
protected void Page_Load(object sender, EventArgs e)
{
createChart(WebChartViewer0, 0);
createChart(WebChartViewer1, 1);
createChart(WebChartViewer2, 2);
createChart(WebChartViewer3, 3);
}
</script>
<html>
<head>
<script type="text/javascript" src="cdjcv.js"></script>
</head>
<body>
<chart:WebChartViewer id="WebChartViewer0" runat="server" />
<chart:WebChartViewer id="WebChartViewer1" runat="server" />
<chart:WebChartViewer id="WebChartViewer2" runat="server" />
<chart:WebChartViewer id="WebChartViewer3" runat="server" />
</body>
</html>
[ASP.NET Web Forms - VB Version] NetWebCharts\VBNetASP\background.aspx
(Click here on how to convert this code to code-behind style.)<%@ Page Language="VB" Debug="true" %>
<%@ Import Namespace="ChartDirector" %>
<%@ Register TagPrefix="chart" Namespace="ChartDirector" Assembly="netchartdir" %>
<!DOCTYPE html>
<script runat="server">
'
' Create chart
'
Protected Sub createChart(viewer As WebChartViewer, chartIndex As Integer)
' The data for the chart
Dim data() As Double = {85, 156, 179.5, 211, 123}
Dim labels() As String = {"Mon", "Tue", "Wed", "Thu", "Fri"}
' Create a XYChart object of size 270 x 270 pixels
Dim c As XYChart = New XYChart(270, 270)
' Set the plot area at (40, 32) and of size 200 x 200 pixels
Dim plotarea As PlotArea = c.setPlotArea(40, 32, 200, 200)
' Set the background style based on the input parameter
If chartIndex = 0 Then
' Has wallpaper image
c.setWallpaper(Server.MapPath("tile.png"))
ElseIf chartIndex = 1 Then
' Use a background image as the plot area background
plotarea.setBackground2(Server.MapPath("bg.png"))
ElseIf chartIndex = 2 Then
' Use white (0xffffff) and grey (0xe0e0e0) as two alternate plotarea background colors
plotarea.setBackground(&Hffffff, &He0e0e0)
Else
' Use a dark background palette
c.setColors(Chart.whiteOnBlackPalette)
End If
' Set the labels on the x axis
c.xAxis().setLabels(labels)
' Add a color bar layer using the given data. Use a 1 pixel 3D border for the bars.
c.addBarLayer3(data).setBorderColor(-1, 1)
' Output the chart
viewer.Image = c.makeWebImage(Chart.SVG)
' Include tool tip for the chart
viewer.ImageMap = c.getHTMLImageMap("", "", "title='Revenue for {xLabel}: US${value}K'")
End Sub
'
' Page Load event handler
'
Protected Sub Page_Load(ByVal sender As System.Object, ByVal e As System.EventArgs)
createChart(WebChartViewer0, 0)
createChart(WebChartViewer1, 1)
createChart(WebChartViewer2, 2)
createChart(WebChartViewer3, 3)
End Sub
</script>
<html>
<head>
<script type="text/javascript" src="cdjcv.js"></script>
</head>
<body>
<chart:WebChartViewer id="WebChartViewer0" runat="server" />
<chart:WebChartViewer id="WebChartViewer1" runat="server" />
<chart:WebChartViewer id="WebChartViewer2" runat="server" />
<chart:WebChartViewer id="WebChartViewer3" runat="server" />
</body>
</html>
[ASP.NET MVC - Controller] NetMvcCharts\Controllers\BackgroundController.cs
using System;
using System.Web.Mvc;
using ChartDirector;

namespace NetMvcCharts.Controllers
{
    public class BackgroundController : Controller
    {
        //
        // Default Action
        //
        public ActionResult Index()
        {
            ViewBag.Title = "Background and Wallpaper";

            // This example contains 4 charts.
            ViewBag.Viewer = new RazorChartViewer[4];
            for (int i = 0; i < ViewBag.Viewer.Length; ++i)
                createChart(ViewBag.Viewer[i] = new RazorChartViewer(HttpContext, "chart" + i), i);

            return View("~/Views/Shared/ChartView.cshtml");
        }

        //
        // Create chart
        //
        private void createChart(RazorChartViewer viewer, int chartIndex)
        {
            // The data for the chart
            double[] data = {85, 156, 179.5, 211, 123};
            string[] labels = {"Mon", "Tue", "Wed", "Thu", "Fri"};

            // Create a XYChart object of size 270 x 270 pixels
            XYChart c = new XYChart(270, 270);

            // Set the plot area at (40, 32) and of size 200 x 200 pixels
            PlotArea plotarea = c.setPlotArea(40, 32, 200, 200);

            // Set the background style based on the input parameter
            if (chartIndex == 0) {
                // Has wallpaper image
                c.setWallpaper(Url.Content("~/Content/tile.png"));
            } else if (chartIndex == 1) {
                // Use a background image as the plot area background
                plotarea.setBackground2(Url.Content("~/Content/bg.png"));
            } else if (chartIndex == 2) {
                // Use white (0xffffff) and grey (0xe0e0e0) as two alternate plotarea background colors
                plotarea.setBackground(0xffffff, 0xe0e0e0);
            } else {
                // Use a dark background palette
                c.setColors(Chart.whiteOnBlackPalette);
            }

            // Set the labels on the x axis
            c.xAxis().setLabels(labels);

            // Add a color bar layer using the given data. Use a 1 pixel 3D border for the bars.
            c.addBarLayer3(data).setBorderColor(-1, 1);

            // Output the chart
            viewer.Image = c.makeWebImage(Chart.SVG);

            // Include tool tip for the chart
            viewer.ImageMap = c.getHTMLImageMap("", "", "title='Revenue for {xLabel}: US${value}K'");
        }
    }
}
[ASP.NET MVC - View] NetMvcCharts\Views\Shared\ChartView.cshtml
@{ Layout = null; }

<!DOCTYPE html>

<html>
<head>
    <meta name="viewport" content="width=device-width" />
    <title>@ViewBag.Title</title>
    <style>
        @ViewBag.Style
    </style>
    @Scripts.Render("~/Scripts/cdjcv.js")
</head>
<body style="margin:5px 0px 0px 5px">
    <div style="font:bold 18pt verdana;">
        @ViewBag.Title
    </div>
    <hr style="border:solid 1px #000080; background:#000080" />
    <div>
        @{
            if (ViewBag.Viewer is Array)
            {
                // Display multiple charts
                for (int i = 0; i < ViewBag.Viewer.Length; ++i)
                {
                    @:@Html.Raw(ViewBag.Viewer[i].RenderHTML())
                }
            }
            else
            {
                // Display one chart only
                @:@Html.Raw(ViewBag.Viewer.RenderHTML())
            }
        }
    </div>
</body>
</html>
© 2023 Advanced Software Engineering Limited. All rights reserved.