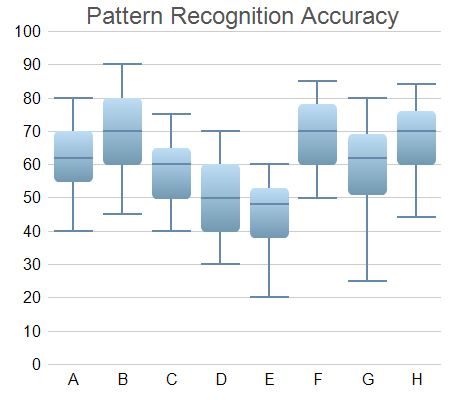
This example extends the Box-Whisker Chart (1) example to demonstrates various methods to control the chart appearance, including using different colors and font size, and using gradient shading and rounded corners for the boxes.
ChartDirector 7.1 (.NET Edition)
Box-Whisker Chart (2)
Source Code Listing
using System;
using ChartDirector;

namespace CSharpChartExplorer
{
    public class boxwhisker2 : DemoModule
    {
        //Name of demo module
        public string getName() { return "Box-Whisker Chart (2)"; }

        //Number of charts produced in this demo module
        public int getNoOfCharts() { return 1; }

        //Main code for creating chart.
        //Note: the argument chartIndex is unused because this demo only has 1 chart.
        public void createChart(WinChartViewer viewer, int chartIndex)
        {
            // Sample data for the Box-Whisker chart. Represents the minimum, 1st quartile, medium,
            // 3rd quartile and maximum values of some quantities
            double[] Q0Data = {40, 45, 40, 30, 20, 50, 25, 44};
            double[] Q1Data = {55, 60, 50, 40, 38, 60, 51, 60};
            double[] Q2Data = {62, 70, 60, 50, 48, 70, 62, 70};
            double[] Q3Data = {70, 80, 65, 60, 53, 78, 69, 76};
            double[] Q4Data = {80, 90, 75, 70, 60, 85, 80, 84};

            // The labels for the chart
            string[] labels = {"A", "B", "C", "D", "E", "F", "G", "H"};

            // Create a XYChart object of size 450 x 400 pixels
            XYChart c = new XYChart(450, 400);

            // Set the plotarea at (50, 30) and of size 380 x 340 pixels, with transparent
            // background and border and light grey (0xcccccc) horizontal grid lines
            c.setPlotArea(50, 30, 380, 340, Chart.Transparent, -1, Chart.Transparent, 0xcccccc);

            // Add a title box using grey (0x555555) 18pt Arial font
            ChartDirector.TextBox title = c.addTitle("     Pattern Recognition Accuracy", "Arial",
                18, 0x555555);

            // Set the x and y axis stems to transparent and the label font to 12pt Arial
            c.xAxis().setColors(Chart.Transparent);
            c.yAxis().setColors(Chart.Transparent);
            c.xAxis().setLabelStyle("Arial", 12);
            c.yAxis().setLabelStyle("Arial", 12);

            // Set the labels on the x axis
            c.xAxis().setLabels(labels);

            // For the automatic y-axis labels, set the minimum spacing to 30 pixels.
            c.yAxis().setTickDensity(30);

            // Add a box whisker layer using light blue (0x99ccee) for the fill color and blue
            // (0x6688aa) for the whisker color. Set line width to 2 pixels. Use rounded corners and
            // bar lighting effect.
            BoxWhiskerLayer b = c.addBoxWhiskerLayer(Q3Data, Q1Data, Q4Data, Q0Data, Q2Data,
                0x99ccee, 0x6688aa);
            b.setLineWidth(2);
            b.setRoundedCorners();
            b.setBorderColor(Chart.Transparent, Chart.barLighting());

            // Adjust the plot area to fit under the title with 10-pixel margin on the other three
            // sides.
            c.packPlotArea(10, title.getHeight(), c.getWidth() - 10, c.getHeight() - 10);

            // Output the chart
            viewer.Chart = c;

            //include tool tip for the chart
            viewer.ImageMap = c.getHTMLImageMap("clickable", "",
                "title='[{xLabel}] min/med/max = {min}/{med}/{max}\nInter-quartile range: " +
                "{bottom} to {top}'");
        }
    }
}Imports System
Imports Microsoft.VisualBasic
Imports ChartDirector
Public Class boxwhisker2
Implements DemoModule
'Name of demo module
Public Function getName() As String Implements DemoModule.getName
Return "Box-Whisker Chart (2)"
End Function
'Number of charts produced in this demo module
Public Function getNoOfCharts() As Integer Implements DemoModule.getNoOfCharts
Return 1
End Function
'Main code for creating chart.
'Note: the argument chartIndex is unused because this demo only has 1 chart.
Public Sub createChart(viewer As WinChartViewer, chartIndex As Integer) _
Implements DemoModule.createChart
' Sample data for the Box-Whisker chart. Represents the minimum, 1st quartile, medium, 3rd
' quartile and maximum values of some quantities
Dim Q0Data() As Double = {40, 45, 40, 30, 20, 50, 25, 44}
Dim Q1Data() As Double = {55, 60, 50, 40, 38, 60, 51, 60}
Dim Q2Data() As Double = {62, 70, 60, 50, 48, 70, 62, 70}
Dim Q3Data() As Double = {70, 80, 65, 60, 53, 78, 69, 76}
Dim Q4Data() As Double = {80, 90, 75, 70, 60, 85, 80, 84}
' The labels for the chart
Dim labels() As String = {"A", "B", "C", "D", "E", "F", "G", "H"}
' Create a XYChart object of size 450 x 400 pixels
Dim c As XYChart = New XYChart(450, 400)
' Set the plotarea at (50, 30) and of size 380 x 340 pixels, with transparent background and
' border and light grey (0xcccccc) horizontal grid lines
c.setPlotArea(50, 30, 380, 340, Chart.Transparent, -1, Chart.Transparent, &Hcccccc)
' Add a title box using grey (0x555555) 18pt Arial font
Dim title As ChartDirector.TextBox = c.addTitle(" Pattern Recognition Accuracy", _
"Arial", 18, &H555555)
' Set the x and y axis stems to transparent and the label font to 12pt Arial
c.xAxis().setColors(Chart.Transparent)
c.yAxis().setColors(Chart.Transparent)
c.xAxis().setLabelStyle("Arial", 12)
c.yAxis().setLabelStyle("Arial", 12)
' Set the labels on the x axis
c.xAxis().setLabels(labels)
' For the automatic y-axis labels, set the minimum spacing to 30 pixels.
c.yAxis().setTickDensity(30)
' Add a box whisker layer using light blue (0x99ccee) for the fill color and blue (0x6688aa)
' for the whisker color. Set line width to 2 pixels. Use rounded corners and bar lighting
' effect.
Dim b As BoxWhiskerLayer = c.addBoxWhiskerLayer(Q3Data, Q1Data, Q4Data, Q0Data, Q2Data, _
&H99ccee, &H6688aa)
b.setLineWidth(2)
b.setRoundedCorners()
b.setBorderColor(Chart.Transparent, Chart.barLighting())
' Adjust the plot area to fit under the title with 10-pixel margin on the other three sides.
c.packPlotArea(10, title.getHeight(), c.getWidth() - 10, c.getHeight() - 10)
' Output the chart
viewer.Chart = c
'include tool tip for the chart
viewer.ImageMap = c.getHTMLImageMap("clickable", "", _
"title='[{xLabel}] min/med/max = {min}/{med}/{max}" & vbLf & _
"Inter-quartile range: {bottom} to {top}'")
End Sub
End Classusing System;
using ChartDirector;
namespace CSharpWPFCharts
{
public class boxwhisker2 : DemoModule
{
//Name of demo module
public string getName() { return "Box-Whisker Chart (2)"; }
//Number of charts produced in this demo module
public int getNoOfCharts() { return 1; }
//Main code for creating chart.
//Note: the argument chartIndex is unused because this demo only has 1 chart.
public void createChart(WPFChartViewer viewer, int chartIndex)
{
// Sample data for the Box-Whisker chart. Represents the minimum, 1st quartile, medium,
// 3rd quartile and maximum values of some quantities
double[] Q0Data = {40, 45, 40, 30, 20, 50, 25, 44};
double[] Q1Data = {55, 60, 50, 40, 38, 60, 51, 60};
double[] Q2Data = {62, 70, 60, 50, 48, 70, 62, 70};
double[] Q3Data = {70, 80, 65, 60, 53, 78, 69, 76};
double[] Q4Data = {80, 90, 75, 70, 60, 85, 80, 84};
// The labels for the chart
string[] labels = {"A", "B", "C", "D", "E", "F", "G", "H"};
// Create a XYChart object of size 450 x 400 pixels
XYChart c = new XYChart(450, 400);
// Set the plotarea at (50, 30) and of size 380 x 340 pixels, with transparent
// background and border and light grey (0xcccccc) horizontal grid lines
c.setPlotArea(50, 30, 380, 340, Chart.Transparent, -1, Chart.Transparent, 0xcccccc);
// Add a title box using grey (0x555555) 18pt Arial font
ChartDirector.TextBox title = c.addTitle(" Pattern Recognition Accuracy", "Arial",
18, 0x555555);
// Set the x and y axis stems to transparent and the label font to 12pt Arial
c.xAxis().setColors(Chart.Transparent);
c.yAxis().setColors(Chart.Transparent);
c.xAxis().setLabelStyle("Arial", 12);
c.yAxis().setLabelStyle("Arial", 12);
// Set the labels on the x axis
c.xAxis().setLabels(labels);
// For the automatic y-axis labels, set the minimum spacing to 30 pixels.
c.yAxis().setTickDensity(30);
// Add a box whisker layer using light blue (0x99ccee) for the fill color and blue
// (0x6688aa) for the whisker color. Set line width to 2 pixels. Use rounded corners and
// bar lighting effect.
BoxWhiskerLayer b = c.addBoxWhiskerLayer(Q3Data, Q1Data, Q4Data, Q0Data, Q2Data,
0x99ccee, 0x6688aa);
b.setLineWidth(2);
b.setRoundedCorners();
b.setBorderColor(Chart.Transparent, Chart.barLighting());
// Adjust the plot area to fit under the title with 10-pixel margin on the other three
// sides.
c.packPlotArea(10, title.getHeight(), c.getWidth() - 10, c.getHeight() - 10);
// Output the chart
viewer.Chart = c;
//include tool tip for the chart
viewer.ImageMap = c.getHTMLImageMap("clickable", "",
"title='[{xLabel}] min/med/max = {min}/{med}/{max}\nInter-quartile range: " +
"{bottom} to {top}'");
}
}
}<%@ Page Language="C#" Debug="true" %>
<%@ Import Namespace="ChartDirector" %>
<%@ Register TagPrefix="chart" Namespace="ChartDirector" Assembly="netchartdir" %>
<!DOCTYPE html>
<script runat="server">
//
// Page Load event handler
//
protected void Page_Load(object sender, EventArgs e)
{
// Sample data for the Box-Whisker chart. Represents the minimum, 1st quartile, medium, 3rd
// quartile and maximum values of some quantities
double[] Q0Data = {40, 45, 40, 30, 20, 50, 25, 44};
double[] Q1Data = {55, 60, 50, 40, 38, 60, 51, 60};
double[] Q2Data = {62, 70, 60, 50, 48, 70, 62, 70};
double[] Q3Data = {70, 80, 65, 60, 53, 78, 69, 76};
double[] Q4Data = {80, 90, 75, 70, 60, 85, 80, 84};
// The labels for the chart
string[] labels = {"A", "B", "C", "D", "E", "F", "G", "H"};
// Create a XYChart object of size 450 x 400 pixels
XYChart c = new XYChart(450, 400);
// Set the plotarea at (50, 30) and of size 380 x 340 pixels, with transparent background and
// border and light grey (0xcccccc) horizontal grid lines
c.setPlotArea(50, 30, 380, 340, Chart.Transparent, -1, Chart.Transparent, 0xcccccc);
// Add a title box using grey (0x555555) 18pt Arial font
ChartDirector.TextBox title = c.addTitle(" Pattern Recognition Accuracy", "Arial", 18,
0x555555);
// Set the x and y axis stems to transparent and the label font to 12pt Arial
c.xAxis().setColors(Chart.Transparent);
c.yAxis().setColors(Chart.Transparent);
c.xAxis().setLabelStyle("Arial", 12);
c.yAxis().setLabelStyle("Arial", 12);
// Set the labels on the x axis
c.xAxis().setLabels(labels);
// For the automatic y-axis labels, set the minimum spacing to 30 pixels.
c.yAxis().setTickDensity(30);
// Add a box whisker layer using light blue (0x99ccee) for the fill color and blue (0x6688aa)
// for the whisker color. Set line width to 2 pixels. Use rounded corners and bar lighting
// effect.
BoxWhiskerLayer b = c.addBoxWhiskerLayer(Q3Data, Q1Data, Q4Data, Q0Data, Q2Data, 0x99ccee,
0x6688aa);
b.setLineWidth(2);
b.setRoundedCorners();
b.setBorderColor(Chart.Transparent, Chart.barLighting());
// Adjust the plot area to fit under the title with 10-pixel margin on the other three sides.
c.packPlotArea(10, title.getHeight(), c.getWidth() - 10, c.getHeight() - 10);
// Output the chart
WebChartViewer1.Image = c.makeWebImage(Chart.SVG);
// Include tool tip for the chart
WebChartViewer1.ImageMap = c.getHTMLImageMap("", "",
"title='[{xLabel}] min/med/max = {min}/{med}/{max}\nInter-quartile range: {bottom} to " +
"{top}'");
}
</script>
<html>
<head>
<script type="text/javascript" src="cdjcv.js"></script>
</head>
<body>
<chart:WebChartViewer id="WebChartViewer1" runat="server" />
</body>
</html><%@ Page Language="VB" Debug="true" %>
<%@ Import Namespace="ChartDirector" %>
<%@ Register TagPrefix="chart" Namespace="ChartDirector" Assembly="netchartdir" %>
<!DOCTYPE html>
<script runat="server">
'
' Page Load event handler
'
Protected Sub Page_Load(ByVal sender As System.Object, ByVal e As System.EventArgs)
' Sample data for the Box-Whisker chart. Represents the minimum, 1st quartile, medium, 3rd
' quartile and maximum values of some quantities
Dim Q0Data() As Double = {40, 45, 40, 30, 20, 50, 25, 44}
Dim Q1Data() As Double = {55, 60, 50, 40, 38, 60, 51, 60}
Dim Q2Data() As Double = {62, 70, 60, 50, 48, 70, 62, 70}
Dim Q3Data() As Double = {70, 80, 65, 60, 53, 78, 69, 76}
Dim Q4Data() As Double = {80, 90, 75, 70, 60, 85, 80, 84}
' The labels for the chart
Dim labels() As String = {"A", "B", "C", "D", "E", "F", "G", "H"}
' Create a XYChart object of size 450 x 400 pixels
Dim c As XYChart = New XYChart(450, 400)
' Set the plotarea at (50, 30) and of size 380 x 340 pixels, with transparent background and
' border and light grey (0xcccccc) horizontal grid lines
c.setPlotArea(50, 30, 380, 340, Chart.Transparent, -1, Chart.Transparent, &Hcccccc)
' Add a title box using grey (0x555555) 18pt Arial font
Dim title As ChartDirector.TextBox = c.addTitle(" Pattern Recognition Accuracy", "Arial", _
18, &H555555)
' Set the x and y axis stems to transparent and the label font to 12pt Arial
c.xAxis().setColors(Chart.Transparent)
c.yAxis().setColors(Chart.Transparent)
c.xAxis().setLabelStyle("Arial", 12)
c.yAxis().setLabelStyle("Arial", 12)
' Set the labels on the x axis
c.xAxis().setLabels(labels)
' For the automatic y-axis labels, set the minimum spacing to 30 pixels.
c.yAxis().setTickDensity(30)
' Add a box whisker layer using light blue (0x99ccee) for the fill color and blue (0x6688aa) for
' the whisker color. Set line width to 2 pixels. Use rounded corners and bar lighting effect.
Dim b As BoxWhiskerLayer = c.addBoxWhiskerLayer(Q3Data, Q1Data, Q4Data, Q0Data, Q2Data, _
&H99ccee, &H6688aa)
b.setLineWidth(2)
b.setRoundedCorners()
b.setBorderColor(Chart.Transparent, Chart.barLighting())
' Adjust the plot area to fit under the title with 10-pixel margin on the other three sides.
c.packPlotArea(10, title.getHeight(), c.getWidth() - 10, c.getHeight() - 10)
' Output the chart
WebChartViewer1.Image = c.makeWebImage(Chart.SVG)
' Include tool tip for the chart
WebChartViewer1.ImageMap = c.getHTMLImageMap("", "", _
"title='[{xLabel}] min/med/max = {min}/{med}/{max}" & vbLf & _
"Inter-quartile range: {bottom} to {top}'")
End Sub
</script>
<html>
<head>
<script type="text/javascript" src="cdjcv.js"></script>
</head>
<body>
<chart:WebChartViewer id="WebChartViewer1" runat="server" />
</body>
</html>using System;
using System.Web.Mvc;
using ChartDirector;
namespace NetMvcCharts.Controllers
{
public class Boxwhisker2Controller : Controller
{
//
// Default Action
//
public ActionResult Index()
{
ViewBag.Title = "Box-Whisker Chart (2)";
createChart(ViewBag.Viewer = new RazorChartViewer(HttpContext, "chart1"));
return View("~/Views/Shared/ChartView.cshtml");
}
//
// Create chart
//
private void createChart(RazorChartViewer viewer)
{
// Sample data for the Box-Whisker chart. Represents the minimum, 1st quartile, medium, 3rd
// quartile and maximum values of some quantities
double[] Q0Data = {40, 45, 40, 30, 20, 50, 25, 44};
double[] Q1Data = {55, 60, 50, 40, 38, 60, 51, 60};
double[] Q2Data = {62, 70, 60, 50, 48, 70, 62, 70};
double[] Q3Data = {70, 80, 65, 60, 53, 78, 69, 76};
double[] Q4Data = {80, 90, 75, 70, 60, 85, 80, 84};
// The labels for the chart
string[] labels = {"A", "B", "C", "D", "E", "F", "G", "H"};
// Create a XYChart object of size 450 x 400 pixels
XYChart c = new XYChart(450, 400);
// Set the plotarea at (50, 30) and of size 380 x 340 pixels, with transparent background and
// border and light grey (0xcccccc) horizontal grid lines
c.setPlotArea(50, 30, 380, 340, Chart.Transparent, -1, Chart.Transparent, 0xcccccc);
// Add a title box using grey (0x555555) 18pt Arial font
ChartDirector.TextBox title = c.addTitle(" Pattern Recognition Accuracy", "Arial", 18,
0x555555);
// Set the x and y axis stems to transparent and the label font to 12pt Arial
c.xAxis().setColors(Chart.Transparent);
c.yAxis().setColors(Chart.Transparent);
c.xAxis().setLabelStyle("Arial", 12);
c.yAxis().setLabelStyle("Arial", 12);
// Set the labels on the x axis
c.xAxis().setLabels(labels);
// For the automatic y-axis labels, set the minimum spacing to 30 pixels.
c.yAxis().setTickDensity(30);
// Add a box whisker layer using light blue (0x99ccee) for the fill color and blue (0x6688aa)
// for the whisker color. Set line width to 2 pixels. Use rounded corners and bar lighting
// effect.
BoxWhiskerLayer b = c.addBoxWhiskerLayer(Q3Data, Q1Data, Q4Data, Q0Data, Q2Data, 0x99ccee,
0x6688aa);
b.setLineWidth(2);
b.setRoundedCorners();
b.setBorderColor(Chart.Transparent, Chart.barLighting());
// Adjust the plot area to fit under the title with 10-pixel margin on the other three sides.
c.packPlotArea(10, title.getHeight(), c.getWidth() - 10, c.getHeight() - 10);
// Output the chart
viewer.Image = c.makeWebImage(Chart.SVG);
// Include tool tip for the chart
viewer.ImageMap = c.getHTMLImageMap("", "",
"title='[{xLabel}] min/med/max = {min}/{med}/{max}\nInter-quartile range: {bottom} to " +
"{top}'");
}
}
}@{ Layout = null; }
<!DOCTYPE html>
<html>
<head>
<meta name="viewport" content="width=device-width" />
<title>@ViewBag.Title</title>
<style>
@ViewBag.Style
</style>
@Scripts.Render("~/Scripts/cdjcv.js")
</head>
<body style="margin:5px 0px 0px 5px">
<div style="font:bold 18pt verdana;">
@ViewBag.Title
</div>
<hr style="border:solid 1px #000080; background:#000080" />
<div>
@{
if (ViewBag.Viewer is Array)
{
// Display multiple charts
for (int i = 0; i < ViewBag.Viewer.Length; ++i)
{
@:@Html.Raw(ViewBag.Viewer[i].RenderHTML())
}
}
else
{
// Display one chart only
@:@Html.Raw(ViewBag.Viewer.RenderHTML())
}
}
</div>
</body>
</html>