[Windows Forms - C# version] NetWinCharts\CSharpWinCharts\circularbarmeter.cs
using System;
using ChartDirector;
namespace CSharpChartExplorer
{
public class circularbarmeter : DemoModule
{
//Name of demo module
public string getName() { return "Circular Bar Meters"; }
//Number of charts produced in this demo module
public int getNoOfCharts() { return 8; }
//Main code for creating charts
public void createChart(WinChartViewer viewer, int chartIndex)
{
// The value to display on the meter
double value = 77;
// The meter radius and angle
int radius = 50;
double angle = value * 360.0 / 100;
// Create an AngularMeter with transparent background
AngularMeter m = new AngularMeter(radius * 2 + 10, radius * 2 + 10, Chart.Transparent);
// Set the center, radius and angular range of the meter
m.setMeter(m.getWidth() / 2, m.getHeight() / 2, radius, 0, 360);
// For circular bar meters, we do not need pointer or graduation, so we hide them.
m.setMeterColors(Chart.Transparent, Chart.Transparent, Chart.Transparent);
m.setCap(0, Chart.Transparent);
//
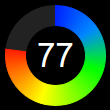
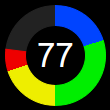
// This example demonstrates several coloring styles
//
// Thd default fill and blank colors
int fillColor = 0x6699ff;
int blankColor = 0xeeeeee;
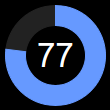
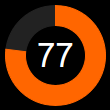
if (chartIndex >= 4) {
// Use dark background style
m.setColors(Chart.whiteOnBlackPalette);
blankColor = 0x222222;
}
if (chartIndex % 4 == 1) {
// Alternative fill color
fillColor = 0xff6600;
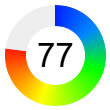
} else if (chartIndex % 4 == 2) {
// Use a smooth color scale as the fill color
int[] smoothColorScale = {0, 0x0022ff, 15, 0x0088ff, 30, 0x00ff00, 55, 0xffff00, 80,
0xff0000, 100, 0xff0000};
fillColor = m.getDrawArea().angleGradientColor(m.getWidth() / 2, m.getHeight() / 2,
0, 360, radius, radius - 20, smoothColorScale);
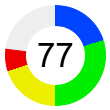
} else if (chartIndex % 4 == 3) {
// Use a step color scale as the fill color
int[] stepColorScale = {0, 0x0044ff, 20, 0x00ee00, 50, 0xeeee00, 70, 0xee0000, 100};
fillColor = m.getDrawArea().angleGradientColor(m.getWidth() / 2, m.getHeight() / 2,
0, 360, radius, radius - 20, stepColorScale);
}
// Draw the blank part of the circular bar
if (angle < 360) {
m.addRingSector(radius, radius - 20, angle, 360, blankColor);
}
// Draw the fill part of the circular bar
if (angle > 0) {
m.addRingSector(radius, radius - 20, 0, angle, fillColor);
}
// Add a label at the center to display the value
m.addText(m.getWidth() / 2, m.getHeight() / 2, m.formatValue(value, "{value}"), "Arial",
25, Chart.TextColor, Chart.Center).setMargin(0);
// Output the chart
viewer.Chart = m;
}
}
}
[Windows Forms - VB Version] NetWinCharts\VBNetWinCharts\circularbarmeter.vb
Imports System
Imports Microsoft.VisualBasic
Imports ChartDirector

Public Class circularbarmeter
    Implements DemoModule

    'Name of demo module
    Public Function getName() As String Implements DemoModule.getName
        Return "Circular Bar Meters"
    End Function

    'Number of charts produced in this demo module
    Public Function getNoOfCharts() As Integer Implements DemoModule.getNoOfCharts
        Return 8
    End Function

    'Main code for creating charts
    Public Sub createChart(viewer As WinChartViewer, chartIndex As Integer) _
        Implements DemoModule.createChart

        ' The value to display on the meter
        Dim value As Double = 77

        ' The meter radius and angle
        Dim radius As Integer = 50
        Dim angle As Double = value * 360.0 / 100

        ' Create an AngularMeter with transparent background
        Dim m As AngularMeter = New AngularMeter(radius * 2 + 10, radius * 2 + 10, _
            Chart.Transparent)

        ' Set the center, radius and angular range of the meter
        m.setMeter(m.getWidth() \ 2, m.getHeight() \ 2, radius, 0, 360)

        ' For circular bar meters, we do not need pointer or graduation, so we hide them.
        m.setMeterColors(Chart.Transparent, Chart.Transparent, Chart.Transparent)
        m.setCap(0, Chart.Transparent)

        '
        ' This example demonstrates several coloring styles
        '

        ' Thd default fill and blank colors
        Dim fillColor As Integer = &H6699ff
        Dim blankColor As Integer = &Heeeeee

        If chartIndex >= 4 Then
            ' Use dark background style
            m.setColors(Chart.whiteOnBlackPalette)
            blankColor = &H222222
        End If

        If chartIndex Mod 4 = 1 Then
            ' Alternative fill color
            fillColor = &Hff6600
        ElseIf chartIndex Mod 4 = 2 Then
            ' Use a smooth color scale as the fill color
            Dim smoothColorScale() As Integer = {0, &H0022ff, 15, &H0088ff, 30, &H00ff00, 55, _
                &Hffff00, 80, &Hff0000, 100, &Hff0000}
            fillColor = m.getDrawArea().angleGradientColor(m.getWidth() \ 2, m.getHeight() \ 2, 0, _
                360, radius, radius - 20, smoothColorScale)
        ElseIf chartIndex Mod 4 = 3 Then
            ' Use a step color scale as the fill color
            Dim stepColorScale() As Integer = {0, &H0044ff, 20, &H00ee00, 50, &Heeee00, 70, _
                &Hee0000, 100}
            fillColor = m.getDrawArea().angleGradientColor(m.getWidth() \ 2, m.getHeight() \ 2, 0, _
                360, radius, radius - 20, stepColorScale)
        End If

        ' Draw the blank part of the circular bar
        If angle < 360 Then
            m.addRingSector(radius, radius - 20, angle, 360, blankColor)
        End If

        ' Draw the fill part of the circular bar
        If angle > 0 Then
            m.addRingSector(radius, radius - 20, 0, angle, fillColor)
        End If

        ' Add a label at the center to display the value
        m.addText(m.getWidth() \ 2, m.getHeight() \ 2, m.formatValue(value, "{value}"), "Arial", _
            25, Chart.TextColor, Chart.Center).setMargin(0)

        ' Output the chart
        viewer.Chart = m

    End Sub

End Class
[WPF - C#] NetWPFCharts\CSharpWPFCharts\circularbarmeter.cs
using System;
using ChartDirector;

namespace CSharpWPFCharts
{
    public class circularbarmeter : DemoModule
    {
        //Name of demo module
        public string getName() { return "Circular Bar Meters"; }

        //Number of charts produced in this demo module
        public int getNoOfCharts() { return 8; }

        //Main code for creating charts
        public void createChart(WPFChartViewer viewer, int chartIndex)
        {
            // The value to display on the meter
            double value = 77;

            // The meter radius and angle
            int radius = 50;
            double angle = value * 360.0 / 100;

            // Create an AngularMeter with transparent background
            AngularMeter m = new AngularMeter(radius * 2 + 10, radius * 2 + 10, Chart.Transparent);

            // Set the center, radius and angular range of the meter
            m.setMeter(m.getWidth() / 2, m.getHeight() / 2, radius, 0, 360);

            // For circular bar meters, we do not need pointer or graduation, so we hide them.
            m.setMeterColors(Chart.Transparent, Chart.Transparent, Chart.Transparent);
            m.setCap(0, Chart.Transparent);

            //
            // This example demonstrates several coloring styles
            //

            // Thd default fill and blank colors
            int fillColor = 0x6699ff;
            int blankColor = 0xeeeeee;

            if (chartIndex >= 4) {
                // Use dark background style
                m.setColors(Chart.whiteOnBlackPalette);
                blankColor = 0x222222;
            }

            if (chartIndex % 4 == 1) {
                // Alternative fill color
                fillColor = 0xff6600;
            } else if (chartIndex % 4 == 2) {
                // Use a smooth color scale as the fill color
                int[] smoothColorScale = {0, 0x0022ff, 15, 0x0088ff, 30, 0x00ff00, 55, 0xffff00, 80,
                    0xff0000, 100, 0xff0000};
                fillColor = m.getDrawArea().angleGradientColor(m.getWidth() / 2, m.getHeight() / 2,
                    0, 360, radius, radius - 20, smoothColorScale);
            } else if (chartIndex % 4 == 3) {
                // Use a step color scale as the fill color
                int[] stepColorScale = {0, 0x0044ff, 20, 0x00ee00, 50, 0xeeee00, 70, 0xee0000, 100};
                fillColor = m.getDrawArea().angleGradientColor(m.getWidth() / 2, m.getHeight() / 2,
                    0, 360, radius, radius - 20, stepColorScale);
            }

            // Draw the blank part of the circular bar
            if (angle < 360) {
                m.addRingSector(radius, radius - 20, angle, 360, blankColor);
            }

            // Draw the fill part of the circular bar
            if (angle > 0) {
                m.addRingSector(radius, radius - 20, 0, angle, fillColor);
            }

            // Add a label at the center to display the value
            m.addText(m.getWidth() / 2, m.getHeight() / 2, m.formatValue(value, "{value}"), "Arial",
                25, Chart.TextColor, Chart.Center).setMargin(0);

            // Output the chart
            viewer.Chart = m;
        }
    }
}
[ASP.NET Web Forms - C# version] NetWebCharts\CSharpASP\circularbarmeter.aspx
(Click here on how to convert this code to code-behind style.)<%@ Page Language="C#" Debug="true" %>
<%@ Import Namespace="ChartDirector" %>
<%@ Register TagPrefix="chart" Namespace="ChartDirector" Assembly="netchartdir" %>
<!DOCTYPE html>
<script runat="server">
//
// Create chart
//
protected void createChart(WebChartViewer viewer, int chartIndex)
{
// The value to display on the meter
double value = 77;
// The meter radius and angle
int radius = 50;
double angle = value * 360.0 / 100;
// Create an AngularMeter with transparent background
AngularMeter m = new AngularMeter(radius * 2 + 10, radius * 2 + 10, Chart.Transparent);
// Set the center, radius and angular range of the meter
m.setMeter(m.getWidth() / 2, m.getHeight() / 2, radius, 0, 360);
// For circular bar meters, we do not need pointer or graduation, so we hide them.
m.setMeterColors(Chart.Transparent, Chart.Transparent, Chart.Transparent);
m.setCap(0, Chart.Transparent);
//
// This example demonstrates several coloring styles
//
// Thd default fill and blank colors
int fillColor = 0x6699ff;
int blankColor = 0xeeeeee;
if (chartIndex >= 4) {
// Use dark background style
m.setColors(Chart.whiteOnBlackPalette);
blankColor = 0x222222;
}
if (chartIndex % 4 == 1) {
// Alternative fill color
fillColor = 0xff6600;
} else if (chartIndex % 4 == 2) {
// Use a smooth color scale as the fill color
int[] smoothColorScale = {0, 0x0022ff, 15, 0x0088ff, 30, 0x00ff00, 55, 0xffff00, 80,
0xff0000, 100, 0xff0000};
fillColor = m.getDrawArea().angleGradientColor(m.getWidth() / 2, m.getHeight() / 2, 0, 360,
radius, radius - 20, smoothColorScale);
} else if (chartIndex % 4 == 3) {
// Use a step color scale as the fill color
int[] stepColorScale = {0, 0x0044ff, 20, 0x00ee00, 50, 0xeeee00, 70, 0xee0000, 100};
fillColor = m.getDrawArea().angleGradientColor(m.getWidth() / 2, m.getHeight() / 2, 0, 360,
radius, radius - 20, stepColorScale);
}
// Draw the blank part of the circular bar
if (angle < 360) {
m.addRingSector(radius, radius - 20, angle, 360, blankColor);
}
// Draw the fill part of the circular bar
if (angle > 0) {
m.addRingSector(radius, radius - 20, 0, angle, fillColor);
}
// Add a label at the center to display the value
m.addText(m.getWidth() / 2, m.getHeight() / 2, m.formatValue(value, "{value}"), "Arial", 25,
Chart.TextColor, Chart.Center).setMargin(0);
// Output the chart
viewer.Image = m.makeWebImage(Chart.SVG);
}
//
// Page Load event handler
//
protected void Page_Load(object sender, EventArgs e)
{
createChart(WebChartViewer0, 0);
createChart(WebChartViewer1, 1);
createChart(WebChartViewer2, 2);
createChart(WebChartViewer3, 3);
createChart(WebChartViewer4, 4);
createChart(WebChartViewer5, 5);
createChart(WebChartViewer6, 6);
createChart(WebChartViewer7, 7);
}
</script>
<html>
<head>
<script type="text/javascript" src="cdjcv.js"></script>
</head>
<body>
<chart:WebChartViewer id="WebChartViewer0" runat="server" />
<chart:WebChartViewer id="WebChartViewer1" runat="server" />
<chart:WebChartViewer id="WebChartViewer2" runat="server" />
<chart:WebChartViewer id="WebChartViewer3" runat="server" />
<chart:WebChartViewer id="WebChartViewer4" runat="server" />
<chart:WebChartViewer id="WebChartViewer5" runat="server" />
<chart:WebChartViewer id="WebChartViewer6" runat="server" />
<chart:WebChartViewer id="WebChartViewer7" runat="server" />
</body>
</html>
[ASP.NET Web Forms - VB Version] NetWebCharts\VBNetASP\circularbarmeter.aspx
(Click here on how to convert this code to code-behind style.)<%@ Page Language="VB" Debug="true" %>
<%@ Import Namespace="ChartDirector" %>
<%@ Register TagPrefix="chart" Namespace="ChartDirector" Assembly="netchartdir" %>
<!DOCTYPE html>
<script runat="server">
'
' Create chart
'
Protected Sub createChart(viewer As WebChartViewer, chartIndex As Integer)
' The value to display on the meter
Dim value As Double = 77
' The meter radius and angle
Dim radius As Integer = 50
Dim angle As Double = value * 360.0 / 100
' Create an AngularMeter with transparent background
Dim m As AngularMeter = New AngularMeter(radius * 2 + 10, radius * 2 + 10, Chart.Transparent)
' Set the center, radius and angular range of the meter
m.setMeter(m.getWidth() \ 2, m.getHeight() \ 2, radius, 0, 360)
' For circular bar meters, we do not need pointer or graduation, so we hide them.
m.setMeterColors(Chart.Transparent, Chart.Transparent, Chart.Transparent)
m.setCap(0, Chart.Transparent)
'
' This example demonstrates several coloring styles
'
' Thd default fill and blank colors
Dim fillColor As Integer = &H6699ff
Dim blankColor As Integer = &Heeeeee
If chartIndex >= 4 Then
' Use dark background style
m.setColors(Chart.whiteOnBlackPalette)
blankColor = &H222222
End If
If chartIndex Mod 4 = 1 Then
' Alternative fill color
fillColor = &Hff6600
ElseIf chartIndex Mod 4 = 2 Then
' Use a smooth color scale as the fill color
Dim smoothColorScale() As Integer = {0, &H0022ff, 15, &H0088ff, 30, &H00ff00, 55, _
&Hffff00, 80, &Hff0000, 100, &Hff0000}
fillColor = m.getDrawArea().angleGradientColor(m.getWidth() \ 2, m.getHeight() \ 2, 0, _
360, radius, radius - 20, smoothColorScale)
ElseIf chartIndex Mod 4 = 3 Then
' Use a step color scale as the fill color
Dim stepColorScale() As Integer = {0, &H0044ff, 20, &H00ee00, 50, &Heeee00, 70, &Hee0000, _
100}
fillColor = m.getDrawArea().angleGradientColor(m.getWidth() \ 2, m.getHeight() \ 2, 0, _
360, radius, radius - 20, stepColorScale)
End If
' Draw the blank part of the circular bar
If angle < 360 Then
m.addRingSector(radius, radius - 20, angle, 360, blankColor)
End If
' Draw the fill part of the circular bar
If angle > 0 Then
m.addRingSector(radius, radius - 20, 0, angle, fillColor)
End If
' Add a label at the center to display the value
m.addText(m.getWidth() \ 2, m.getHeight() \ 2, m.formatValue(value, "{value}"), "Arial", 25, _
Chart.TextColor, Chart.Center).setMargin(0)
' Output the chart
viewer.Image = m.makeWebImage(Chart.SVG)
End Sub
'
' Page Load event handler
'
Protected Sub Page_Load(ByVal sender As System.Object, ByVal e As System.EventArgs)
createChart(WebChartViewer0, 0)
createChart(WebChartViewer1, 1)
createChart(WebChartViewer2, 2)
createChart(WebChartViewer3, 3)
createChart(WebChartViewer4, 4)
createChart(WebChartViewer5, 5)
createChart(WebChartViewer6, 6)
createChart(WebChartViewer7, 7)
End Sub
</script>
<html>
<head>
<script type="text/javascript" src="cdjcv.js"></script>
</head>
<body>
<chart:WebChartViewer id="WebChartViewer0" runat="server" />
<chart:WebChartViewer id="WebChartViewer1" runat="server" />
<chart:WebChartViewer id="WebChartViewer2" runat="server" />
<chart:WebChartViewer id="WebChartViewer3" runat="server" />
<chart:WebChartViewer id="WebChartViewer4" runat="server" />
<chart:WebChartViewer id="WebChartViewer5" runat="server" />
<chart:WebChartViewer id="WebChartViewer6" runat="server" />
<chart:WebChartViewer id="WebChartViewer7" runat="server" />
</body>
</html>
[ASP.NET MVC - Controller] NetMvcCharts\Controllers\CircularbarmeterController.cs
using System;
using System.Web.Mvc;
using ChartDirector;

namespace NetMvcCharts.Controllers
{
    public class CircularbarmeterController : Controller
    {
        //
        // Default Action
        //
        public ActionResult Index()
        {
            ViewBag.Title = "Circular Bar Meters";

            // This example contains 8 charts.
            ViewBag.Viewer = new RazorChartViewer[8];
            for (int i = 0; i < ViewBag.Viewer.Length; ++i)
                createChart(ViewBag.Viewer[i] = new RazorChartViewer(HttpContext, "chart" + i), i);

            return View("~/Views/Shared/ChartView.cshtml");
        }

        //
        // Create chart
        //
        private void createChart(RazorChartViewer viewer, int chartIndex)
        {
            // The value to display on the meter
            double value = 77;

            // The meter radius and angle
            int radius = 50;
            double angle = value * 360.0 / 100;

            // Create an AngularMeter with transparent background
            AngularMeter m = new AngularMeter(radius * 2 + 10, radius * 2 + 10, Chart.Transparent);

            // Set the center, radius and angular range of the meter
            m.setMeter(m.getWidth() / 2, m.getHeight() / 2, radius, 0, 360);

            // For circular bar meters, we do not need pointer or graduation, so we hide them.
            m.setMeterColors(Chart.Transparent, Chart.Transparent, Chart.Transparent);
            m.setCap(0, Chart.Transparent);

            //
            // This example demonstrates several coloring styles
            //

            // Thd default fill and blank colors
            int fillColor = 0x6699ff;
            int blankColor = 0xeeeeee;

            if (chartIndex >= 4) {
                // Use dark background style
                m.setColors(Chart.whiteOnBlackPalette);
                blankColor = 0x222222;
            }

            if (chartIndex % 4 == 1) {
                // Alternative fill color
                fillColor = 0xff6600;
            } else if (chartIndex % 4 == 2) {
                // Use a smooth color scale as the fill color
                int[] smoothColorScale = {0, 0x0022ff, 15, 0x0088ff, 30, 0x00ff00, 55, 0xffff00, 80,
                    0xff0000, 100, 0xff0000};
                fillColor = m.getDrawArea().angleGradientColor(m.getWidth() / 2, m.getHeight() / 2, 0,
                    360, radius, radius - 20, smoothColorScale);
            } else if (chartIndex % 4 == 3) {
                // Use a step color scale as the fill color
                int[] stepColorScale = {0, 0x0044ff, 20, 0x00ee00, 50, 0xeeee00, 70, 0xee0000, 100};
                fillColor = m.getDrawArea().angleGradientColor(m.getWidth() / 2, m.getHeight() / 2, 0,
                    360, radius, radius - 20, stepColorScale);
            }

            // Draw the blank part of the circular bar
            if (angle < 360) {
                m.addRingSector(radius, radius - 20, angle, 360, blankColor);
            }

            // Draw the fill part of the circular bar
            if (angle > 0) {
                m.addRingSector(radius, radius - 20, 0, angle, fillColor);
            }

            // Add a label at the center to display the value
            m.addText(m.getWidth() / 2, m.getHeight() / 2, m.formatValue(value, "{value}"), "Arial", 25,
                Chart.TextColor, Chart.Center).setMargin(0);

            // Output the chart
            viewer.Image = m.makeWebImage(Chart.SVG);
        }
    }
}
[ASP.NET MVC - View] NetMvcCharts\Views\Shared\ChartView.cshtml
@{ Layout = null; }

<!DOCTYPE html>

<html>
<head>
    <meta name="viewport" content="width=device-width" />
    <title>@ViewBag.Title</title>
    <style>
        @ViewBag.Style
    </style>
    @Scripts.Render("~/Scripts/cdjcv.js")
</head>
<body style="margin:5px 0px 0px 5px">
    <div style="font:bold 18pt verdana;">
        @ViewBag.Title
    </div>
    <hr style="border:solid 1px #000080; background:#000080" />
    <div>
        @{
            if (ViewBag.Viewer is Array)
            {
                // Display multiple charts
                for (int i = 0; i < ViewBag.Viewer.Length; ++i)
                {
                    @:@Html.Raw(ViewBag.Viewer[i].RenderHTML())
                }
            }
            else
            {
                // Display one chart only
                @:@Html.Raw(ViewBag.Viewer.RenderHTML())
            }
        }
    </div>
</body>
</html>
© 2023 Advanced Software Engineering Limited. All rights reserved.