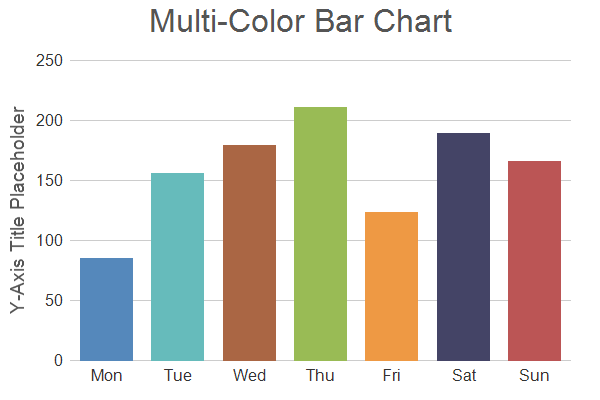
This example is the same as Simple Bar Chart (2), except that XYChart.addBarLayer3 is used to add a multi-color bar layer instead of a regular bar layer.
ChartDirector 7.1 (.NET Edition)
Multi-Color Bar Chart (1)
Source Code Listing
using System;
using ChartDirector;

namespace CSharpChartExplorer
{
    public class colorbar : DemoModule
    {
        //Name of demo module
        public string getName() { return "Multi-Color Bar Chart (1)"; }

        //Number of charts produced in this demo module
        public int getNoOfCharts() { return 1; }

        //Main code for creating chart.
        //Note: the argument chartIndex is unused because this demo only has 1 chart.
        public void createChart(WinChartViewer viewer, int chartIndex)
        {
            // The data for the bar chart
            double[] data = {85, 156, 179, 211, 123, 189, 166};

            // The labels for the bar chart
            string[] labels = {"Mon", "Tue", "Wed", "Thu", "Fri", "Sat", "Sun"};

            // The colors for the bars
            int[] colors = {0x5588bb, 0x66bbbb, 0xaa6644, 0x99bb55, 0xee9944, 0x444466, 0xbb5555};

            // Create a XYChart object of size 600 x 400 pixels
            XYChart c = new XYChart(600, 400);

            // Set default text color to dark grey (0x333333)
            c.setColor(Chart.TextColor, 0x333333);

            // Add a title box using grey (0x555555) 24pt Arial font
            c.addTitle("Multi-Color Bar Chart", "Arial", 24, 0x555555);

            // Set the plotarea at (70, 60) and of size 500 x 300 pixels, with transparent
            // background and border and light grey (0xcccccc) horizontal grid lines
            c.setPlotArea(70, 60, 500, 300, Chart.Transparent, -1, Chart.Transparent, 0xcccccc);

            // Set the x and y axis stems to transparent and the label font to 12pt Arial
            c.xAxis().setColors(Chart.Transparent);
            c.yAxis().setColors(Chart.Transparent);
            c.xAxis().setLabelStyle("Arial", 12);
            c.yAxis().setLabelStyle("Arial", 12);

            // Add a multi-color bar chart layer with transparent border using the given data
            c.addBarLayer3(data, colors).setBorderColor(Chart.Transparent);

            // Set the labels on the x axis.
            c.xAxis().setLabels(labels);

            // For the automatic y-axis labels, set the minimum spacing to 40 pixels.
            c.yAxis().setTickDensity(40);

            // Add a title to the y axis using dark grey (0x555555) 14pt Arial font
            c.yAxis().setTitle("Y-Axis Title Placeholder", "Arial", 14, 0x555555);

            // Output the chart
            viewer.Chart = c;

            //include tool tip for the chart
            viewer.ImageMap = c.getHTMLImageMap("clickable", "", "title='{xLabel}: ${value}M'");
        }
    }
}Imports System
Imports Microsoft.VisualBasic
Imports ChartDirector
Public Class colorbar
Implements DemoModule
'Name of demo module
Public Function getName() As String Implements DemoModule.getName
Return "Multi-Color Bar Chart (1)"
End Function
'Number of charts produced in this demo module
Public Function getNoOfCharts() As Integer Implements DemoModule.getNoOfCharts
Return 1
End Function
'Main code for creating chart.
'Note: the argument chartIndex is unused because this demo only has 1 chart.
Public Sub createChart(viewer As WinChartViewer, chartIndex As Integer) _
Implements DemoModule.createChart
' The data for the bar chart
Dim data() As Double = {85, 156, 179, 211, 123, 189, 166}
' The labels for the bar chart
Dim labels() As String = {"Mon", "Tue", "Wed", "Thu", "Fri", "Sat", "Sun"}
' The colors for the bars
Dim colors() As Integer = {&H5588bb, &H66bbbb, &Haa6644, &H99bb55, &Hee9944, &H444466, _
&Hbb5555}
' Create a XYChart object of size 600 x 400 pixels
Dim c As XYChart = New XYChart(600, 400)
' Set default text color to dark grey (0x333333)
c.setColor(Chart.TextColor, &H333333)
' Add a title box using grey (0x555555) 24pt Arial font
c.addTitle("Multi-Color Bar Chart", "Arial", 24, &H555555)
' Set the plotarea at (70, 60) and of size 500 x 300 pixels, with transparent background and
' border and light grey (0xcccccc) horizontal grid lines
c.setPlotArea(70, 60, 500, 300, Chart.Transparent, -1, Chart.Transparent, &Hcccccc)
' Set the x and y axis stems to transparent and the label font to 12pt Arial
c.xAxis().setColors(Chart.Transparent)
c.yAxis().setColors(Chart.Transparent)
c.xAxis().setLabelStyle("Arial", 12)
c.yAxis().setLabelStyle("Arial", 12)
' Add a multi-color bar chart layer with transparent border using the given data
c.addBarLayer3(data, colors).setBorderColor(Chart.Transparent)
' Set the labels on the x axis.
c.xAxis().setLabels(labels)
' For the automatic y-axis labels, set the minimum spacing to 40 pixels.
c.yAxis().setTickDensity(40)
' Add a title to the y axis using dark grey (0x555555) 14pt Arial font
c.yAxis().setTitle("Y-Axis Title Placeholder", "Arial", 14, &H555555)
' Output the chart
viewer.Chart = c
'include tool tip for the chart
viewer.ImageMap = c.getHTMLImageMap("clickable", "", "title='{xLabel}: ${value}M'")
End Sub
End Classusing System;
using ChartDirector;
namespace CSharpWPFCharts
{
public class colorbar : DemoModule
{
//Name of demo module
public string getName() { return "Multi-Color Bar Chart (1)"; }
//Number of charts produced in this demo module
public int getNoOfCharts() { return 1; }
//Main code for creating chart.
//Note: the argument chartIndex is unused because this demo only has 1 chart.
public void createChart(WPFChartViewer viewer, int chartIndex)
{
// The data for the bar chart
double[] data = {85, 156, 179, 211, 123, 189, 166};
// The labels for the bar chart
string[] labels = {"Mon", "Tue", "Wed", "Thu", "Fri", "Sat", "Sun"};
// The colors for the bars
int[] colors = {0x5588bb, 0x66bbbb, 0xaa6644, 0x99bb55, 0xee9944, 0x444466, 0xbb5555};
// Create a XYChart object of size 600 x 400 pixels
XYChart c = new XYChart(600, 400);
// Set default text color to dark grey (0x333333)
c.setColor(Chart.TextColor, 0x333333);
// Add a title box using grey (0x555555) 24pt Arial font
c.addTitle("Multi-Color Bar Chart", "Arial", 24, 0x555555);
// Set the plotarea at (70, 60) and of size 500 x 300 pixels, with transparent
// background and border and light grey (0xcccccc) horizontal grid lines
c.setPlotArea(70, 60, 500, 300, Chart.Transparent, -1, Chart.Transparent, 0xcccccc);
// Set the x and y axis stems to transparent and the label font to 12pt Arial
c.xAxis().setColors(Chart.Transparent);
c.yAxis().setColors(Chart.Transparent);
c.xAxis().setLabelStyle("Arial", 12);
c.yAxis().setLabelStyle("Arial", 12);
// Add a multi-color bar chart layer with transparent border using the given data
c.addBarLayer3(data, colors).setBorderColor(Chart.Transparent);
// Set the labels on the x axis.
c.xAxis().setLabels(labels);
// For the automatic y-axis labels, set the minimum spacing to 40 pixels.
c.yAxis().setTickDensity(40);
// Add a title to the y axis using dark grey (0x555555) 14pt Arial font
c.yAxis().setTitle("Y-Axis Title Placeholder", "Arial", 14, 0x555555);
// Output the chart
viewer.Chart = c;
//include tool tip for the chart
viewer.ImageMap = c.getHTMLImageMap("clickable", "", "title='{xLabel}: ${value}M'");
}
}
}<%@ Page Language="C#" Debug="true" %>
<%@ Import Namespace="ChartDirector" %>
<%@ Register TagPrefix="chart" Namespace="ChartDirector" Assembly="netchartdir" %>
<!DOCTYPE html>
<script runat="server">
//
// Page Load event handler
//
protected void Page_Load(object sender, EventArgs e)
{
// The data for the bar chart
double[] data = {85, 156, 179, 211, 123, 189, 166};
// The labels for the bar chart
string[] labels = {"Mon", "Tue", "Wed", "Thu", "Fri", "Sat", "Sun"};
// The colors for the bars
int[] colors = {0x5588bb, 0x66bbbb, 0xaa6644, 0x99bb55, 0xee9944, 0x444466, 0xbb5555};
// Create a XYChart object of size 600 x 400 pixels
XYChart c = new XYChart(600, 400);
// Set default text color to dark grey (0x333333)
c.setColor(Chart.TextColor, 0x333333);
// Add a title box using grey (0x555555) 24pt Arial font
c.addTitle("Multi-Color Bar Chart", "Arial", 24, 0x555555);
// Set the plotarea at (70, 60) and of size 500 x 300 pixels, with transparent background and
// border and light grey (0xcccccc) horizontal grid lines
c.setPlotArea(70, 60, 500, 300, Chart.Transparent, -1, Chart.Transparent, 0xcccccc);
// Set the x and y axis stems to transparent and the label font to 12pt Arial
c.xAxis().setColors(Chart.Transparent);
c.yAxis().setColors(Chart.Transparent);
c.xAxis().setLabelStyle("Arial", 12);
c.yAxis().setLabelStyle("Arial", 12);
// Add a multi-color bar chart layer with transparent border using the given data
c.addBarLayer3(data, colors).setBorderColor(Chart.Transparent);
// Set the labels on the x axis.
c.xAxis().setLabels(labels);
// For the automatic y-axis labels, set the minimum spacing to 40 pixels.
c.yAxis().setTickDensity(40);
// Add a title to the y axis using dark grey (0x555555) 14pt Arial font
c.yAxis().setTitle("Y-Axis Title Placeholder", "Arial", 14, 0x555555);
// Output the chart
WebChartViewer1.Image = c.makeWebImage(Chart.SVG);
// Include tool tip for the chart
WebChartViewer1.ImageMap = c.getHTMLImageMap("", "", "title='{xLabel}: ${value}M'");
}
</script>
<html>
<head>
<script type="text/javascript" src="cdjcv.js"></script>
</head>
<body>
<chart:WebChartViewer id="WebChartViewer1" runat="server" />
</body>
</html><%@ Page Language="VB" Debug="true" %>
<%@ Import Namespace="ChartDirector" %>
<%@ Register TagPrefix="chart" Namespace="ChartDirector" Assembly="netchartdir" %>
<!DOCTYPE html>
<script runat="server">
'
' Page Load event handler
'
Protected Sub Page_Load(ByVal sender As System.Object, ByVal e As System.EventArgs)
' The data for the bar chart
Dim data() As Double = {85, 156, 179, 211, 123, 189, 166}
' The labels for the bar chart
Dim labels() As String = {"Mon", "Tue", "Wed", "Thu", "Fri", "Sat", "Sun"}
' The colors for the bars
Dim colors() As Integer = {&H5588bb, &H66bbbb, &Haa6644, &H99bb55, &Hee9944, &H444466, _
&Hbb5555}
' Create a XYChart object of size 600 x 400 pixels
Dim c As XYChart = New XYChart(600, 400)
' Set default text color to dark grey (0x333333)
c.setColor(Chart.TextColor, &H333333)
' Add a title box using grey (0x555555) 24pt Arial font
c.addTitle("Multi-Color Bar Chart", "Arial", 24, &H555555)
' Set the plotarea at (70, 60) and of size 500 x 300 pixels, with transparent background and
' border and light grey (0xcccccc) horizontal grid lines
c.setPlotArea(70, 60, 500, 300, Chart.Transparent, -1, Chart.Transparent, &Hcccccc)
' Set the x and y axis stems to transparent and the label font to 12pt Arial
c.xAxis().setColors(Chart.Transparent)
c.yAxis().setColors(Chart.Transparent)
c.xAxis().setLabelStyle("Arial", 12)
c.yAxis().setLabelStyle("Arial", 12)
' Add a multi-color bar chart layer with transparent border using the given data
c.addBarLayer3(data, colors).setBorderColor(Chart.Transparent)
' Set the labels on the x axis.
c.xAxis().setLabels(labels)
' For the automatic y-axis labels, set the minimum spacing to 40 pixels.
c.yAxis().setTickDensity(40)
' Add a title to the y axis using dark grey (0x555555) 14pt Arial font
c.yAxis().setTitle("Y-Axis Title Placeholder", "Arial", 14, &H555555)
' Output the chart
WebChartViewer1.Image = c.makeWebImage(Chart.SVG)
' Include tool tip for the chart
WebChartViewer1.ImageMap = c.getHTMLImageMap("", "", "title='{xLabel}: ${value}M'")
End Sub
</script>
<html>
<head>
<script type="text/javascript" src="cdjcv.js"></script>
</head>
<body>
<chart:WebChartViewer id="WebChartViewer1" runat="server" />
</body>
</html>using System;
using System.Web.Mvc;
using ChartDirector;
namespace NetMvcCharts.Controllers
{
public class ColorbarController : Controller
{
//
// Default Action
//
public ActionResult Index()
{
ViewBag.Title = "Multi-Color Bar Chart (1)";
createChart(ViewBag.Viewer = new RazorChartViewer(HttpContext, "chart1"));
return View("~/Views/Shared/ChartView.cshtml");
}
//
// Create chart
//
private void createChart(RazorChartViewer viewer)
{
// The data for the bar chart
double[] data = {85, 156, 179, 211, 123, 189, 166};
// The labels for the bar chart
string[] labels = {"Mon", "Tue", "Wed", "Thu", "Fri", "Sat", "Sun"};
// The colors for the bars
int[] colors = {0x5588bb, 0x66bbbb, 0xaa6644, 0x99bb55, 0xee9944, 0x444466, 0xbb5555};
// Create a XYChart object of size 600 x 400 pixels
XYChart c = new XYChart(600, 400);
// Set default text color to dark grey (0x333333)
c.setColor(Chart.TextColor, 0x333333);
// Add a title box using grey (0x555555) 24pt Arial font
c.addTitle("Multi-Color Bar Chart", "Arial", 24, 0x555555);
// Set the plotarea at (70, 60) and of size 500 x 300 pixels, with transparent background and
// border and light grey (0xcccccc) horizontal grid lines
c.setPlotArea(70, 60, 500, 300, Chart.Transparent, -1, Chart.Transparent, 0xcccccc);
// Set the x and y axis stems to transparent and the label font to 12pt Arial
c.xAxis().setColors(Chart.Transparent);
c.yAxis().setColors(Chart.Transparent);
c.xAxis().setLabelStyle("Arial", 12);
c.yAxis().setLabelStyle("Arial", 12);
// Add a multi-color bar chart layer with transparent border using the given data
c.addBarLayer3(data, colors).setBorderColor(Chart.Transparent);
// Set the labels on the x axis.
c.xAxis().setLabels(labels);
// For the automatic y-axis labels, set the minimum spacing to 40 pixels.
c.yAxis().setTickDensity(40);
// Add a title to the y axis using dark grey (0x555555) 14pt Arial font
c.yAxis().setTitle("Y-Axis Title Placeholder", "Arial", 14, 0x555555);
// Output the chart
viewer.Image = c.makeWebImage(Chart.SVG);
// Include tool tip for the chart
viewer.ImageMap = c.getHTMLImageMap("", "", "title='{xLabel}: ${value}M'");
}
}
}@{ Layout = null; }
<!DOCTYPE html>
<html>
<head>
<meta name="viewport" content="width=device-width" />
<title>@ViewBag.Title</title>
<style>
@ViewBag.Style
</style>
@Scripts.Render("~/Scripts/cdjcv.js")
</head>
<body style="margin:5px 0px 0px 5px">
<div style="font:bold 18pt verdana;">
@ViewBag.Title
</div>
<hr style="border:solid 1px #000080; background:#000080" />
<div>
@{
if (ViewBag.Viewer is Array)
{
// Display multiple charts
for (int i = 0; i < ViewBag.Viewer.Length; ++i)
{
@:@Html.Raw(ViewBag.Viewer[i].RenderHTML())
}
}
else
{
// Display one chart only
@:@Html.Raw(ViewBag.Viewer.RenderHTML())
}
}
</div>
</body>
</html>