[Windows Forms - C# version] NetWinCharts\CSharpWinCharts\colorgantt.cs
using System;
using ChartDirector;
namespace CSharpChartExplorer
{
public class colorgantt : DemoModule
{
//Name of demo module
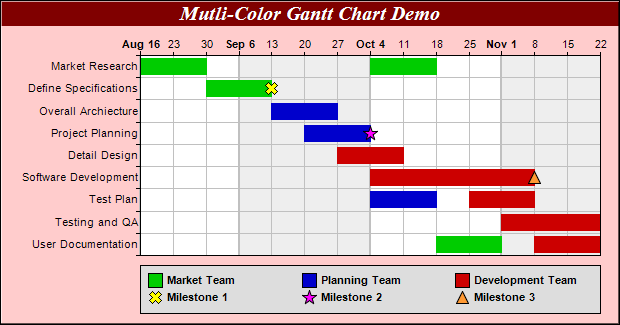
public string getName() { return "Multi-Color Gantt Chart"; }
//Number of charts produced in this demo module
public int getNoOfCharts() { return 1; }
//Main code for creating chart.
//Note: the argument chartIndex is unused because this demo only has 1 chart.
public void createChart(WinChartViewer viewer, int chartIndex)
{
// The tasks for the gantt chart
string[] labels = {"Market Research", "Define Specifications", "Overall Archiecture",
"Project Planning", "Detail Design", "Software Development", "Test Plan",
"Testing and QA", "User Documentation"};
// The task index, start date, end date and color for each bar
double[] taskNo = {0, 0, 1, 2, 3, 4, 5, 6, 6, 7, 8, 8};
DateTime[] startDate = {new DateTime(2018, 8, 16), new DateTime(2018, 10, 4),
new DateTime(2018, 8, 30), new DateTime(2018, 9, 13), new DateTime(2018, 9, 20),
new DateTime(2018, 9, 27), new DateTime(2018, 10, 4), new DateTime(2018, 10, 4),
new DateTime(2018, 10, 25), new DateTime(2018, 11, 1), new DateTime(2018, 10, 18),
new DateTime(2018, 11, 8)};
DateTime[] endDate = {new DateTime(2018, 8, 30), new DateTime(2018, 10, 18),
new DateTime(2018, 9, 13), new DateTime(2018, 9, 27), new DateTime(2018, 10, 4),
new DateTime(2018, 10, 11), new DateTime(2018, 11, 8), new DateTime(2018, 10, 18),
new DateTime(2018, 11, 8), new DateTime(2018, 11, 22), new DateTime(2018, 11, 1),
new DateTime(2018, 11, 22)};
int[] colors = {0x00cc00, 0x00cc00, 0x00cc00, 0x0000cc, 0x0000cc, 0xcc0000, 0xcc0000,
0x0000cc, 0xcc0000, 0xcc0000, 0x00cc00, 0xcc0000};
// Create a XYChart object of size 620 x 325 pixels. Set background color to light red
// (0xffcccc), with 1 pixel 3D border effect.
XYChart c = new XYChart(620, 325, 0xffcccc, 0x000000, 1);
// Add a title to the chart using 15 points Times Bold Itatic font, with white (ffffff)
// text on a dark red (800000) background
c.addTitle("Mutli-Color Gantt Chart Demo", "Times New Roman Bold Italic", 15, 0xffffff
).setBackground(0x800000);
// Set the plotarea at (140, 55) and of size 460 x 200 pixels. Use alternative
// white/grey background. Enable both horizontal and vertical grids by setting their
// colors to grey (c0c0c0). Set vertical major grid (represents month boundaries) 2
// pixels in width
c.setPlotArea(140, 55, 460, 200, 0xffffff, 0xeeeeee, Chart.LineColor, 0xc0c0c0, 0xc0c0c0
).setGridWidth(2, 1, 1, 1);
// swap the x and y axes to create a horziontal box-whisker chart
c.swapXY();
// Set the y-axis scale to be date scale from Aug 16, 2018 to Nov 22, 2018, with ticks
// every 7 days (1 week)
c.yAxis().setDateScale(new DateTime(2018, 8, 16), new DateTime(2018, 11, 22), 86400 * 7)
;
// Set multi-style axis label formatting. Month labels are in Arial Bold font in "mmm d"
// format. Weekly labels just show the day of month and use minor tick (by using '-' as
// first character of format string).
c.yAxis().setMultiFormat(Chart.StartOfMonthFilter(), "<*font=Arial Bold*>{value|mmm d}",
Chart.StartOfDayFilter(), "-{value|d}");
// Set the y-axis to shown on the top (right + swapXY = top)
c.setYAxisOnRight();
// Set the labels on the x axis
c.xAxis().setLabels(labels);
// Reverse the x-axis scale so that it points downwards.
c.xAxis().setReverse();
// Set the horizontal ticks and grid lines to be between the bars
c.xAxis().setTickOffset(0.5);
// Add some symbols to the chart to represent milestones. The symbols are added using
// scatter layers. We need to specify the task index, date, name, symbol shape, size and
// color.
c.addScatterLayer(new double[] {1}, Chart.CTime(new DateTime[] {new DateTime(2018, 9, 13
)}), "Milestone 1", Chart.Cross2Shape(), 13, 0xffff00).setHTMLImageMap("{disable}");
c.addScatterLayer(new double[] {3}, Chart.CTime(new DateTime[] {new DateTime(2018, 10, 4
)}), "Milestone 2", Chart.StarShape(5), 15, 0xff00ff).setHTMLImageMap("{disable}");
c.addScatterLayer(new double[] {5}, Chart.CTime(new DateTime[] {new DateTime(2018, 11, 8
)}), "Milestone 3", Chart.TriangleSymbol, 13, 0xff9933).setHTMLImageMap("{disable}")
;
// Add a multi-color box-whisker layer to represent the gantt bars
BoxWhiskerLayer layer = c.addBoxWhiskerLayer2(Chart.CTime(startDate),
Chart.CTime(endDate), null, null, null, colors);
layer.setXData(taskNo);
layer.setBorderColor(Chart.SameAsMainColor);
// Divide the plot area height ( = 200 in this chart) by the number of tasks to get the
// height of each slot. Use 80% of that as the bar height.
layer.setDataWidth((int)(200 * 0.8 / labels.Length));
// Add a legend box at (140, 265) - bottom of the plot area. Use 8pt Arial Bold as the
// font with auto-grid layout. Set the width to the same width as the plot area. Set the
// backgorund to grey (dddddd).
LegendBox legendBox = c.addLegend2(140, 265, Chart.AutoGrid, "Arial Bold", 8);
legendBox.setWidth(461);
legendBox.setBackground(0xdddddd);
// The keys for the scatter layers (milestone symbols) will automatically be added to
// the legend box. We just need to add keys to show the meanings of the bar colors.
legendBox.addKey("Market Team", 0x00cc00);
legendBox.addKey("Planning Team", 0x0000cc);
legendBox.addKey("Development Team", 0xcc0000);
// Output the chart
viewer.Chart = c;
//include tool tip for the chart
viewer.ImageMap = c.getHTMLImageMap("clickable", "",
"title='{xLabel}: {top|mmm dd, yyyy} to {bottom|mmm dd, yyyy}'");
// Include tool tip for the chart
viewer.ImageMap = c.getHTMLImageMap("clickable");
}
}
}
[Windows Forms - VB Version] NetWinCharts\VBNetWinCharts\colorgantt.vb
Imports System
Imports Microsoft.VisualBasic
Imports ChartDirector

Public Class colorgantt
    Implements DemoModule

    'Name of demo module
    Public Function getName() As String Implements DemoModule.getName
        Return "Multi-Color Gantt Chart"
    End Function

    'Number of charts produced in this demo module
    Public Function getNoOfCharts() As Integer Implements DemoModule.getNoOfCharts
        Return 1
    End Function

    'Main code for creating chart.
    'Note: the argument chartIndex is unused because this demo only has 1 chart.
    Public Sub createChart(viewer As WinChartViewer, chartIndex As Integer) _
        Implements DemoModule.createChart

        ' The tasks for the gantt chart
        Dim labels() As String = {"Market Research", "Define Specifications", _
            "Overall Archiecture", "Project Planning", "Detail Design", "Software Development", _
            "Test Plan", "Testing and QA", "User Documentation"}

        ' The task index, start date, end date and color for each bar
        Dim taskNo() As Double = {0, 0, 1, 2, 3, 4, 5, 6, 6, 7, 8, 8}
        Dim startDate() As Date = {DateSerial(2018, 8, 16), DateSerial(2018, 10, 4), DateSerial( _
            2018, 8, 30), DateSerial(2018, 9, 13), DateSerial(2018, 9, 20), DateSerial(2018, 9, 27 _
            ), DateSerial(2018, 10, 4), DateSerial(2018, 10, 4), DateSerial(2018, 10, 25), _
            DateSerial(2018, 11, 1), DateSerial(2018, 10, 18), DateSerial(2018, 11, 8)}
        Dim endDate() As Date = {DateSerial(2018, 8, 30), DateSerial(2018, 10, 18), DateSerial( _
            2018, 9, 13), DateSerial(2018, 9, 27), DateSerial(2018, 10, 4), DateSerial(2018, 10, _
            11), DateSerial(2018, 11, 8), DateSerial(2018, 10, 18), DateSerial(2018, 11, 8), _
            DateSerial(2018, 11, 22), DateSerial(2018, 11, 1), DateSerial(2018, 11, 22)}
        Dim colors() As Integer = {&H00cc00, &H00cc00, &H00cc00, &H0000cc, &H0000cc, &Hcc0000, _
            &Hcc0000, &H0000cc, &Hcc0000, &Hcc0000, &H00cc00, &Hcc0000}

        ' Create a XYChart object of size 620 x 325 pixels. Set background color to light red
        ' (0xffcccc), with 1 pixel 3D border effect.
        Dim c As XYChart = New XYChart(620, 325, &Hffcccc, &H000000, 1)

        ' Add a title to the chart using 15 points Times Bold Itatic font, with white (ffffff) text
        ' on a dark red (800000) background
        c.addTitle("Mutli-Color Gantt Chart Demo", "Times New Roman Bold Italic", 15, &Hffffff _
            ).setBackground(&H800000)

        ' Set the plotarea at (140, 55) and of size 460 x 200 pixels. Use alternative white/grey
        ' background. Enable both horizontal and vertical grids by setting their colors to grey
        ' (c0c0c0). Set vertical major grid (represents month boundaries) 2 pixels in width
        c.setPlotArea(140, 55, 460, 200, &Hffffff, &Heeeeee, Chart.LineColor, &Hc0c0c0, &Hc0c0c0 _
            ).setGridWidth(2, 1, 1, 1)

        ' swap the x and y axes to create a horziontal box-whisker chart
        c.swapXY()

        ' Set the y-axis scale to be date scale from Aug 16, 2018 to Nov 22, 2018, with ticks every
        ' 7 days (1 week)
        c.yAxis().setDateScale(DateSerial(2018, 8, 16), DateSerial(2018, 11, 22), 86400 * 7)

        ' Set multi-style axis label formatting. Month labels are in Arial Bold font in "mmm d"
        ' format. Weekly labels just show the day of month and use minor tick (by using '-' as first
        ' character of format string).
        c.yAxis().setMultiFormat(Chart.StartOfMonthFilter(), "<*font=Arial Bold*>{value|mmm d}", _
            Chart.StartOfDayFilter(), "-{value|d}")

        ' Set the y-axis to shown on the top (right + swapXY = top)
        c.setYAxisOnRight()

        ' Set the labels on the x axis
        c.xAxis().setLabels(labels)

        ' Reverse the x-axis scale so that it points downwards.
        c.xAxis().setReverse()

        ' Set the horizontal ticks and grid lines to be between the bars
        c.xAxis().setTickOffset(0.5)

        ' Add some symbols to the chart to represent milestones. The symbols are added using scatter
        ' layers. We need to specify the task index, date, name, symbol shape, size and color.
        c.addScatterLayer(New Double() {1}, Chart.CTime(New Date() {DateSerial(2018, 9, 13)}), _
            "Milestone 1", Chart.Cross2Shape(), 13, &Hffff00).setHTMLImageMap("{disable}")
        c.addScatterLayer(New Double() {3}, Chart.CTime(New Date() {DateSerial(2018, 10, 4)}), _
            "Milestone 2", Chart.StarShape(5), 15, &Hff00ff).setHTMLImageMap("{disable}")
        c.addScatterLayer(New Double() {5}, Chart.CTime(New Date() {DateSerial(2018, 11, 8)}), _
            "Milestone 3", Chart.TriangleSymbol, 13, &Hff9933).setHTMLImageMap("{disable}")

        ' Add a multi-color box-whisker layer to represent the gantt bars
        Dim layer As BoxWhiskerLayer = c.addBoxWhiskerLayer2(Chart.CTime(startDate), _
            Chart.CTime(endDate), Nothing, Nothing, Nothing, colors)
        layer.setXData(taskNo)
        layer.setBorderColor(Chart.SameAsMainColor)

        ' Divide the plot area height ( = 200 in this chart) by the number of tasks to get the
        ' height of each slot. Use 80% of that as the bar height.
        layer.setDataWidth(Int(200 * 0.8 / (UBound(labels) + 1)))

        ' Add a legend box at (140, 265) - bottom of the plot area. Use 8pt Arial Bold as the font
        ' with auto-grid layout. Set the width to the same width as the plot area. Set the
        ' backgorund to grey (dddddd).
        Dim legendBox As LegendBox = c.addLegend2(140, 265, Chart.AutoGrid, "Arial Bold", 8)
        legendBox.setWidth(461)
        legendBox.setBackground(&Hdddddd)

        ' The keys for the scatter layers (milestone symbols) will automatically be added to the
        ' legend box. We just need to add keys to show the meanings of the bar colors.
        legendBox.addKey("Market Team", &H00cc00)
        legendBox.addKey("Planning Team", &H0000cc)
        legendBox.addKey("Development Team", &Hcc0000)

        ' Output the chart
        viewer.Chart = c

        'include tool tip for the chart
        viewer.ImageMap = c.getHTMLImageMap("clickable", "", _
            "title='{xLabel}: {top|mmm dd, yyyy} to {bottom|mmm dd, yyyy}'")

        ' Include tool tip for the chart
        viewer.ImageMap = c.getHTMLImageMap("clickable")

    End Sub

End Class
[WPF - C#] NetWPFCharts\CSharpWPFCharts\colorgantt.cs
using System;
using ChartDirector;

namespace CSharpWPFCharts
{
    public class colorgantt : DemoModule
    {
        //Name of demo module
        public string getName() { return "Multi-Color Gantt Chart"; }

        //Number of charts produced in this demo module
        public int getNoOfCharts() { return 1; }

        //Main code for creating chart.
        //Note: the argument chartIndex is unused because this demo only has 1 chart.
        public void createChart(WPFChartViewer viewer, int chartIndex)
        {
            // The tasks for the gantt chart
            string[] labels = {"Market Research", "Define Specifications", "Overall Archiecture",
                "Project Planning", "Detail Design", "Software Development", "Test Plan",
                "Testing and QA", "User Documentation"};

            // The task index, start date, end date and color for each bar
            double[] taskNo = {0, 0, 1, 2, 3, 4, 5, 6, 6, 7, 8, 8};
            DateTime[] startDate = {new DateTime(2018, 8, 16), new DateTime(2018, 10, 4),
                new DateTime(2018, 8, 30), new DateTime(2018, 9, 13), new DateTime(2018, 9, 20),
                new DateTime(2018, 9, 27), new DateTime(2018, 10, 4), new DateTime(2018, 10, 4),
                new DateTime(2018, 10, 25), new DateTime(2018, 11, 1), new DateTime(2018, 10, 18),
                new DateTime(2018, 11, 8)};
            DateTime[] endDate = {new DateTime(2018, 8, 30), new DateTime(2018, 10, 18),
                new DateTime(2018, 9, 13), new DateTime(2018, 9, 27), new DateTime(2018, 10, 4),
                new DateTime(2018, 10, 11), new DateTime(2018, 11, 8), new DateTime(2018, 10, 18),
                new DateTime(2018, 11, 8), new DateTime(2018, 11, 22), new DateTime(2018, 11, 1),
                new DateTime(2018, 11, 22)};
            int[] colors = {0x00cc00, 0x00cc00, 0x00cc00, 0x0000cc, 0x0000cc, 0xcc0000, 0xcc0000,
                0x0000cc, 0xcc0000, 0xcc0000, 0x00cc00, 0xcc0000};

            // Create a XYChart object of size 620 x 325 pixels. Set background color to light red
            // (0xffcccc), with 1 pixel 3D border effect.
            XYChart c = new XYChart(620, 325, 0xffcccc, 0x000000, 1);

            // Add a title to the chart using 15 points Times Bold Itatic font, with white (ffffff)
            // text on a dark red (800000) background
            c.addTitle("Mutli-Color Gantt Chart Demo", "Times New Roman Bold Italic", 15, 0xffffff
                ).setBackground(0x800000);

            // Set the plotarea at (140, 55) and of size 460 x 200 pixels. Use alternative
            // white/grey background. Enable both horizontal and vertical grids by setting their
            // colors to grey (c0c0c0). Set vertical major grid (represents month boundaries) 2
            // pixels in width
            c.setPlotArea(140, 55, 460, 200, 0xffffff, 0xeeeeee, Chart.LineColor, 0xc0c0c0, 0xc0c0c0
                ).setGridWidth(2, 1, 1, 1);

            // swap the x and y axes to create a horziontal box-whisker chart
            c.swapXY();

            // Set the y-axis scale to be date scale from Aug 16, 2018 to Nov 22, 2018, with ticks
            // every 7 days (1 week)
            c.yAxis().setDateScale(new DateTime(2018, 8, 16), new DateTime(2018, 11, 22), 86400 * 7)
                ;

            // Set multi-style axis label formatting. Month labels are in Arial Bold font in "mmm d"
            // format. Weekly labels just show the day of month and use minor tick (by using '-' as
            // first character of format string).
            c.yAxis().setMultiFormat(Chart.StartOfMonthFilter(), "<*font=Arial Bold*>{value|mmm d}",
                Chart.StartOfDayFilter(), "-{value|d}");

            // Set the y-axis to shown on the top (right + swapXY = top)
            c.setYAxisOnRight();

            // Set the labels on the x axis
            c.xAxis().setLabels(labels);

            // Reverse the x-axis scale so that it points downwards.
            c.xAxis().setReverse();

            // Set the horizontal ticks and grid lines to be between the bars
            c.xAxis().setTickOffset(0.5);

            // Add some symbols to the chart to represent milestones. The symbols are added using
            // scatter layers. We need to specify the task index, date, name, symbol shape, size and
            // color.
            c.addScatterLayer(new double[] {1}, Chart.CTime(new DateTime[] {new DateTime(2018, 9, 13
                )}), "Milestone 1", Chart.Cross2Shape(), 13, 0xffff00).setHTMLImageMap("{disable}");
            c.addScatterLayer(new double[] {3}, Chart.CTime(new DateTime[] {new DateTime(2018, 10, 4
                )}), "Milestone 2", Chart.StarShape(5), 15, 0xff00ff).setHTMLImageMap("{disable}");
            c.addScatterLayer(new double[] {5}, Chart.CTime(new DateTime[] {new DateTime(2018, 11, 8
                )}), "Milestone 3", Chart.TriangleSymbol, 13, 0xff9933).setHTMLImageMap("{disable}")
                ;

            // Add a multi-color box-whisker layer to represent the gantt bars
            BoxWhiskerLayer layer = c.addBoxWhiskerLayer2(Chart.CTime(startDate),
                Chart.CTime(endDate), null, null, null, colors);
            layer.setXData(taskNo);
            layer.setBorderColor(Chart.SameAsMainColor);

            // Divide the plot area height ( = 200 in this chart) by the number of tasks to get the
            // height of each slot. Use 80% of that as the bar height.
            layer.setDataWidth((int)(200 * 0.8 / labels.Length));

            // Add a legend box at (140, 265) - bottom of the plot area. Use 8pt Arial Bold as the
            // font with auto-grid layout. Set the width to the same width as the plot area. Set the
            // backgorund to grey (dddddd).
            LegendBox legendBox = c.addLegend2(140, 265, Chart.AutoGrid, "Arial Bold", 8);
            legendBox.setWidth(461);
            legendBox.setBackground(0xdddddd);

            // The keys for the scatter layers (milestone symbols) will automatically be added to
            // the legend box. We just need to add keys to show the meanings of the bar colors.
            legendBox.addKey("Market Team", 0x00cc00);
            legendBox.addKey("Planning Team", 0x0000cc);
            legendBox.addKey("Development Team", 0xcc0000);

            // Output the chart
            viewer.Chart = c;

            //include tool tip for the chart
            viewer.ImageMap = c.getHTMLImageMap("clickable", "",
                "title='{xLabel}: {top|mmm dd, yyyy} to {bottom|mmm dd, yyyy}'");

            // Include tool tip for the chart
            viewer.ImageMap = c.getHTMLImageMap("clickable");
        }
    }
}
[ASP.NET Web Forms - C# version] NetWebCharts\CSharpASP\colorgantt.aspx
(Click here on how to convert this code to code-behind style.)<%@ Page Language="C#" Debug="true" %>
<%@ Import Namespace="ChartDirector" %>
<%@ Register TagPrefix="chart" Namespace="ChartDirector" Assembly="netchartdir" %>
<!DOCTYPE html>
<script runat="server">
//
// Page Load event handler
//
protected void Page_Load(object sender, EventArgs e)
{
// The tasks for the gantt chart
string[] labels = {"Market Research", "Define Specifications", "Overall Archiecture",
"Project Planning", "Detail Design", "Software Development", "Test Plan", "Testing and QA",
"User Documentation"};
// The task index, start date, end date and color for each bar
double[] taskNo = {0, 0, 1, 2, 3, 4, 5, 6, 6, 7, 8, 8};
DateTime[] startDate = {new DateTime(2018, 8, 16), new DateTime(2018, 10, 4), new DateTime(2018,
8, 30), new DateTime(2018, 9, 13), new DateTime(2018, 9, 20), new DateTime(2018, 9, 27),
new DateTime(2018, 10, 4), new DateTime(2018, 10, 4), new DateTime(2018, 10, 25),
new DateTime(2018, 11, 1), new DateTime(2018, 10, 18), new DateTime(2018, 11, 8)};
DateTime[] endDate = {new DateTime(2018, 8, 30), new DateTime(2018, 10, 18), new DateTime(2018,
9, 13), new DateTime(2018, 9, 27), new DateTime(2018, 10, 4), new DateTime(2018, 10, 11),
new DateTime(2018, 11, 8), new DateTime(2018, 10, 18), new DateTime(2018, 11, 8),
new DateTime(2018, 11, 22), new DateTime(2018, 11, 1), new DateTime(2018, 11, 22)};
int[] colors = {0x00cc00, 0x00cc00, 0x00cc00, 0x0000cc, 0x0000cc, 0xcc0000, 0xcc0000, 0x0000cc,
0xcc0000, 0xcc0000, 0x00cc00, 0xcc0000};
// Create a XYChart object of size 620 x 325 pixels. Set background color to light red
// (0xffcccc), with 1 pixel 3D border effect.
XYChart c = new XYChart(620, 325, 0xffcccc, 0x000000, 1);
// Add a title to the chart using 15 points Times Bold Itatic font, with white (ffffff) text on
// a dark red (800000) background
c.addTitle("Mutli-Color Gantt Chart Demo", "Times New Roman Bold Italic", 15, 0xffffff
).setBackground(0x800000);
// Set the plotarea at (140, 55) and of size 460 x 200 pixels. Use alternative white/grey
// background. Enable both horizontal and vertical grids by setting their colors to grey
// (c0c0c0). Set vertical major grid (represents month boundaries) 2 pixels in width
c.setPlotArea(140, 55, 460, 200, 0xffffff, 0xeeeeee, Chart.LineColor, 0xc0c0c0, 0xc0c0c0
).setGridWidth(2, 1, 1, 1);
// swap the x and y axes to create a horziontal box-whisker chart
c.swapXY();
// Set the y-axis scale to be date scale from Aug 16, 2018 to Nov 22, 2018, with ticks every 7
// days (1 week)
c.yAxis().setDateScale(new DateTime(2018, 8, 16), new DateTime(2018, 11, 22), 86400 * 7);
// Set multi-style axis label formatting. Month labels are in Arial Bold font in "mmm d" format.
// Weekly labels just show the day of month and use minor tick (by using '-' as first character
// of format string).
c.yAxis().setMultiFormat(Chart.StartOfMonthFilter(), "<*font=Arial Bold*>{value|mmm d}",
Chart.StartOfDayFilter(), "-{value|d}");
// Set the y-axis to shown on the top (right + swapXY = top)
c.setYAxisOnRight();
// Set the labels on the x axis
c.xAxis().setLabels(labels);
// Reverse the x-axis scale so that it points downwards.
c.xAxis().setReverse();
// Set the horizontal ticks and grid lines to be between the bars
c.xAxis().setTickOffset(0.5);
// Add some symbols to the chart to represent milestones. The symbols are added using scatter
// layers. We need to specify the task index, date, name, symbol shape, size and color.
c.addScatterLayer(new double[] {1}, Chart.CTime(new DateTime[] {new DateTime(2018, 9, 13)}),
"Milestone 1", Chart.Cross2Shape(), 13, 0xffff00).setHTMLImageMap("{disable}");
c.addScatterLayer(new double[] {3}, Chart.CTime(new DateTime[] {new DateTime(2018, 10, 4)}),
"Milestone 2", Chart.StarShape(5), 15, 0xff00ff).setHTMLImageMap("{disable}");
c.addScatterLayer(new double[] {5}, Chart.CTime(new DateTime[] {new DateTime(2018, 11, 8)}),
"Milestone 3", Chart.TriangleSymbol, 13, 0xff9933).setHTMLImageMap("{disable}");
// Add a multi-color box-whisker layer to represent the gantt bars
BoxWhiskerLayer layer = c.addBoxWhiskerLayer2(Chart.CTime(startDate), Chart.CTime(endDate),
null, null, null, colors);
layer.setXData(taskNo);
layer.setBorderColor(Chart.SameAsMainColor);
// Divide the plot area height ( = 200 in this chart) by the number of tasks to get the height
// of each slot. Use 80% of that as the bar height.
layer.setDataWidth((int)(200 * 0.8 / labels.Length));
// Add a legend box at (140, 265) - bottom of the plot area. Use 8pt Arial Bold as the font with
// auto-grid layout. Set the width to the same width as the plot area. Set the backgorund to
// grey (dddddd).
LegendBox legendBox = c.addLegend2(140, 265, Chart.AutoGrid, "Arial Bold", 8);
legendBox.setWidth(461);
legendBox.setBackground(0xdddddd);
// The keys for the scatter layers (milestone symbols) will automatically be added to the legend
// box. We just need to add keys to show the meanings of the bar colors.
legendBox.addKey("Market Team", 0x00cc00);
legendBox.addKey("Planning Team", 0x0000cc);
legendBox.addKey("Development Team", 0xcc0000);
// Output the chart
WebChartViewer1.Image = c.makeWebImage(Chart.SVG);
// Include tool tip for the chart
WebChartViewer1.ImageMap = c.getHTMLImageMap("", "",
"title='{xLabel}: {top|mmm dd, yyyy} to {bottom|mmm dd, yyyy}'");
}
</script>
<html>
<head>
<script type="text/javascript" src="cdjcv.js"></script>
</head>
<body>
<chart:WebChartViewer id="WebChartViewer1" runat="server" />
</body>
</html>
[ASP.NET Web Forms - VB Version] NetWebCharts\VBNetASP\colorgantt.aspx
(Click here on how to convert this code to code-behind style.)<%@ Page Language="VB" Debug="true" %>
<%@ Import Namespace="ChartDirector" %>
<%@ Register TagPrefix="chart" Namespace="ChartDirector" Assembly="netchartdir" %>
<!DOCTYPE html>
<script runat="server">
'
' Page Load event handler
'
Protected Sub Page_Load(ByVal sender As System.Object, ByVal e As System.EventArgs)
' The tasks for the gantt chart
Dim labels() As String = {"Market Research", "Define Specifications", "Overall Archiecture", _
"Project Planning", "Detail Design", "Software Development", "Test Plan", _
"Testing and QA", "User Documentation"}
' The task index, start date, end date and color for each bar
Dim taskNo() As Double = {0, 0, 1, 2, 3, 4, 5, 6, 6, 7, 8, 8}
Dim startDate() As Date = {DateSerial(2018, 8, 16), DateSerial(2018, 10, 4), DateSerial(2018, _
8, 30), DateSerial(2018, 9, 13), DateSerial(2018, 9, 20), DateSerial(2018, 9, 27), _
DateSerial(2018, 10, 4), DateSerial(2018, 10, 4), DateSerial(2018, 10, 25), DateSerial( _
2018, 11, 1), DateSerial(2018, 10, 18), DateSerial(2018, 11, 8)}
Dim endDate() As Date = {DateSerial(2018, 8, 30), DateSerial(2018, 10, 18), DateSerial(2018, _
9, 13), DateSerial(2018, 9, 27), DateSerial(2018, 10, 4), DateSerial(2018, 10, 11), _
DateSerial(2018, 11, 8), DateSerial(2018, 10, 18), DateSerial(2018, 11, 8), DateSerial( _
2018, 11, 22), DateSerial(2018, 11, 1), DateSerial(2018, 11, 22)}
Dim colors() As Integer = {&H00cc00, &H00cc00, &H00cc00, &H0000cc, &H0000cc, &Hcc0000, _
&Hcc0000, &H0000cc, &Hcc0000, &Hcc0000, &H00cc00, &Hcc0000}
' Create a XYChart object of size 620 x 325 pixels. Set background color to light red
' (0xffcccc), with 1 pixel 3D border effect.
Dim c As XYChart = New XYChart(620, 325, &Hffcccc, &H000000, 1)
' Add a title to the chart using 15 points Times Bold Itatic font, with white (ffffff) text on a
' dark red (800000) background
c.addTitle("Mutli-Color Gantt Chart Demo", "Times New Roman Bold Italic", 15, &Hffffff _
).setBackground(&H800000)
' Set the plotarea at (140, 55) and of size 460 x 200 pixels. Use alternative white/grey
' background. Enable both horizontal and vertical grids by setting their colors to grey
' (c0c0c0). Set vertical major grid (represents month boundaries) 2 pixels in width
c.setPlotArea(140, 55, 460, 200, &Hffffff, &Heeeeee, Chart.LineColor, &Hc0c0c0, &Hc0c0c0 _
).setGridWidth(2, 1, 1, 1)
' swap the x and y axes to create a horziontal box-whisker chart
c.swapXY()
' Set the y-axis scale to be date scale from Aug 16, 2018 to Nov 22, 2018, with ticks every 7
' days (1 week)
c.yAxis().setDateScale(DateSerial(2018, 8, 16), DateSerial(2018, 11, 22), 86400 * 7)
' Set multi-style axis label formatting. Month labels are in Arial Bold font in "mmm d" format.
' Weekly labels just show the day of month and use minor tick (by using '-' as first character
' of format string).
c.yAxis().setMultiFormat(Chart.StartOfMonthFilter(), "<*font=Arial Bold*>{value|mmm d}", _
Chart.StartOfDayFilter(), "-{value|d}")
' Set the y-axis to shown on the top (right + swapXY = top)
c.setYAxisOnRight()
' Set the labels on the x axis
c.xAxis().setLabels(labels)
' Reverse the x-axis scale so that it points downwards.
c.xAxis().setReverse()
' Set the horizontal ticks and grid lines to be between the bars
c.xAxis().setTickOffset(0.5)
' Add some symbols to the chart to represent milestones. The symbols are added using scatter
' layers. We need to specify the task index, date, name, symbol shape, size and color.
c.addScatterLayer(New Double() {1}, Chart.CTime(New Date() {DateSerial(2018, 9, 13)}), _
"Milestone 1", Chart.Cross2Shape(), 13, &Hffff00).setHTMLImageMap("{disable}")
c.addScatterLayer(New Double() {3}, Chart.CTime(New Date() {DateSerial(2018, 10, 4)}), _
"Milestone 2", Chart.StarShape(5), 15, &Hff00ff).setHTMLImageMap("{disable}")
c.addScatterLayer(New Double() {5}, Chart.CTime(New Date() {DateSerial(2018, 11, 8)}), _
"Milestone 3", Chart.TriangleSymbol, 13, &Hff9933).setHTMLImageMap("{disable}")
' Add a multi-color box-whisker layer to represent the gantt bars
Dim layer As BoxWhiskerLayer = c.addBoxWhiskerLayer2(Chart.CTime(startDate), _
Chart.CTime(endDate), Nothing, Nothing, Nothing, colors)
layer.setXData(taskNo)
layer.setBorderColor(Chart.SameAsMainColor)
' Divide the plot area height ( = 200 in this chart) by the number of tasks to get the height of
' each slot. Use 80% of that as the bar height.
layer.setDataWidth(Int(200 * 0.8 / (UBound(labels) + 1)))
' Add a legend box at (140, 265) - bottom of the plot area. Use 8pt Arial Bold as the font with
' auto-grid layout. Set the width to the same width as the plot area. Set the backgorund to grey
' (dddddd).
Dim legendBox As LegendBox = c.addLegend2(140, 265, Chart.AutoGrid, "Arial Bold", 8)
legendBox.setWidth(461)
legendBox.setBackground(&Hdddddd)
' The keys for the scatter layers (milestone symbols) will automatically be added to the legend
' box. We just need to add keys to show the meanings of the bar colors.
legendBox.addKey("Market Team", &H00cc00)
legendBox.addKey("Planning Team", &H0000cc)
legendBox.addKey("Development Team", &Hcc0000)
' Output the chart
WebChartViewer1.Image = c.makeWebImage(Chart.SVG)
' Include tool tip for the chart
WebChartViewer1.ImageMap = c.getHTMLImageMap("", "", _
"title='{xLabel}: {top|mmm dd, yyyy} to {bottom|mmm dd, yyyy}'")
End Sub
</script>
<html>
<head>
<script type="text/javascript" src="cdjcv.js"></script>
</head>
<body>
<chart:WebChartViewer id="WebChartViewer1" runat="server" />
</body>
</html>
[ASP.NET MVC - Controller] NetMvcCharts\Controllers\ColorganttController.cs
using System;
using System.Web.Mvc;
using ChartDirector;

namespace NetMvcCharts.Controllers
{
    public class ColorganttController : Controller
    {
        //
        // Default Action
        //
        public ActionResult Index()
        {
            ViewBag.Title = "Multi-Color Gantt Chart";
            createChart(ViewBag.Viewer = new RazorChartViewer(HttpContext, "chart1"));
            return View("~/Views/Shared/ChartView.cshtml");
        }

        //
        // Create chart
        //
        private void createChart(RazorChartViewer viewer)
        {
            // The tasks for the gantt chart
            string[] labels = {"Market Research", "Define Specifications", "Overall Archiecture",
                "Project Planning", "Detail Design", "Software Development", "Test Plan",
                "Testing and QA", "User Documentation"};

            // The task index, start date, end date and color for each bar
            double[] taskNo = {0, 0, 1, 2, 3, 4, 5, 6, 6, 7, 8, 8};
            DateTime[] startDate = {new DateTime(2018, 8, 16), new DateTime(2018, 10, 4), new DateTime(
                2018, 8, 30), new DateTime(2018, 9, 13), new DateTime(2018, 9, 20), new DateTime(2018, 9,
                27), new DateTime(2018, 10, 4), new DateTime(2018, 10, 4), new DateTime(2018, 10, 25),
                new DateTime(2018, 11, 1), new DateTime(2018, 10, 18), new DateTime(2018, 11, 8)};
            DateTime[] endDate = {new DateTime(2018, 8, 30), new DateTime(2018, 10, 18), new DateTime(
                2018, 9, 13), new DateTime(2018, 9, 27), new DateTime(2018, 10, 4), new DateTime(2018,
                10, 11), new DateTime(2018, 11, 8), new DateTime(2018, 10, 18), new DateTime(2018, 11, 8
                ), new DateTime(2018, 11, 22), new DateTime(2018, 11, 1), new DateTime(2018, 11, 22)};
            int[] colors = {0x00cc00, 0x00cc00, 0x00cc00, 0x0000cc, 0x0000cc, 0xcc0000, 0xcc0000,
                0x0000cc, 0xcc0000, 0xcc0000, 0x00cc00, 0xcc0000};

            // Create a XYChart object of size 620 x 325 pixels. Set background color to light red
            // (0xffcccc), with 1 pixel 3D border effect.
            XYChart c = new XYChart(620, 325, 0xffcccc, 0x000000, 1);

            // Add a title to the chart using 15 points Times Bold Itatic font, with white (ffffff) text
            // on a dark red (800000) background
            c.addTitle("Mutli-Color Gantt Chart Demo", "Times New Roman Bold Italic", 15, 0xffffff
                ).setBackground(0x800000);

            // Set the plotarea at (140, 55) and of size 460 x 200 pixels. Use alternative white/grey
            // background. Enable both horizontal and vertical grids by setting their colors to grey
            // (c0c0c0). Set vertical major grid (represents month boundaries) 2 pixels in width
            c.setPlotArea(140, 55, 460, 200, 0xffffff, 0xeeeeee, Chart.LineColor, 0xc0c0c0, 0xc0c0c0
                ).setGridWidth(2, 1, 1, 1);

            // swap the x and y axes to create a horziontal box-whisker chart
            c.swapXY();

            // Set the y-axis scale to be date scale from Aug 16, 2018 to Nov 22, 2018, with ticks every
            // 7 days (1 week)
            c.yAxis().setDateScale(new DateTime(2018, 8, 16), new DateTime(2018, 11, 22), 86400 * 7);

            // Set multi-style axis label formatting. Month labels are in Arial Bold font in "mmm d"
            // format. Weekly labels just show the day of month and use minor tick (by using '-' as first
            // character of format string).
            c.yAxis().setMultiFormat(Chart.StartOfMonthFilter(), "<*font=Arial Bold*>{value|mmm d}",
                Chart.StartOfDayFilter(), "-{value|d}");

            // Set the y-axis to shown on the top (right + swapXY = top)
            c.setYAxisOnRight();

            // Set the labels on the x axis
            c.xAxis().setLabels(labels);

            // Reverse the x-axis scale so that it points downwards.
            c.xAxis().setReverse();

            // Set the horizontal ticks and grid lines to be between the bars
            c.xAxis().setTickOffset(0.5);

            // Add some symbols to the chart to represent milestones. The symbols are added using scatter
            // layers. We need to specify the task index, date, name, symbol shape, size and color.
            c.addScatterLayer(new double[] {1}, Chart.CTime(new DateTime[] {new DateTime(2018, 9, 13)}),
                "Milestone 1", Chart.Cross2Shape(), 13, 0xffff00).setHTMLImageMap("{disable}");
            c.addScatterLayer(new double[] {3}, Chart.CTime(new DateTime[] {new DateTime(2018, 10, 4)}),
                "Milestone 2", Chart.StarShape(5), 15, 0xff00ff).setHTMLImageMap("{disable}");
            c.addScatterLayer(new double[] {5}, Chart.CTime(new DateTime[] {new DateTime(2018, 11, 8)}),
                "Milestone 3", Chart.TriangleSymbol, 13, 0xff9933).setHTMLImageMap("{disable}");

            // Add a multi-color box-whisker layer to represent the gantt bars
            BoxWhiskerLayer layer = c.addBoxWhiskerLayer2(Chart.CTime(startDate), Chart.CTime(endDate),
                null, null, null, colors);
            layer.setXData(taskNo);
            layer.setBorderColor(Chart.SameAsMainColor);

            // Divide the plot area height ( = 200 in this chart) by the number of tasks to get the
            // height of each slot. Use 80% of that as the bar height.
            layer.setDataWidth((int)(200 * 0.8 / labels.Length));

            // Add a legend box at (140, 265) - bottom of the plot area. Use 8pt Arial Bold as the font
            // with auto-grid layout. Set the width to the same width as the plot area. Set the
            // backgorund to grey (dddddd).
            LegendBox legendBox = c.addLegend2(140, 265, Chart.AutoGrid, "Arial Bold", 8);
            legendBox.setWidth(461);
            legendBox.setBackground(0xdddddd);

            // The keys for the scatter layers (milestone symbols) will automatically be added to the
            // legend box. We just need to add keys to show the meanings of the bar colors.
            legendBox.addKey("Market Team", 0x00cc00);
            legendBox.addKey("Planning Team", 0x0000cc);
            legendBox.addKey("Development Team", 0xcc0000);

            // Output the chart
            viewer.Image = c.makeWebImage(Chart.SVG);

            // Include tool tip for the chart
            viewer.ImageMap = c.getHTMLImageMap("", "",
                "title='{xLabel}: {top|mmm dd, yyyy} to {bottom|mmm dd, yyyy}'");
        }
    }
}
[ASP.NET MVC - View] NetMvcCharts\Views\Shared\ChartView.cshtml
@{ Layout = null; }

<!DOCTYPE html>

<html>
<head>
    <meta name="viewport" content="width=device-width" />
    <title>@ViewBag.Title</title>
    <style>
        @ViewBag.Style
    </style>
    @Scripts.Render("~/Scripts/cdjcv.js")
</head>
<body style="margin:5px 0px 0px 5px">
    <div style="font:bold 18pt verdana;">
        @ViewBag.Title
    </div>
    <hr style="border:solid 1px #000080; background:#000080" />
    <div>
        @{
            if (ViewBag.Viewer is Array)
            {
                // Display multiple charts
                for (int i = 0; i < ViewBag.Viewer.Length; ++i)
                {
                    @:@Html.Raw(ViewBag.Viewer[i].RenderHTML())
                }
            }
            else
            {
                // Display one chart only
                @:@Html.Raw(ViewBag.Viewer.RenderHTML())
            }
        }
    </div>
</body>
</html>
© 2023 Advanced Software Engineering Limited. All rights reserved.