[Windows Forms - C# version] NetWinCharts\CSharpWinCharts\compactline.cs
using System;
using ChartDirector;
namespace CSharpChartExplorer
{
public class compactline : DemoModule
{
//Name of demo module
public string getName() { return "Compact Line Chart"; }
//Number of charts produced in this demo module
public int getNoOfCharts() { return 1; }
//Main code for creating chart.
//Note: the argument chartIndex is unused because this demo only has 1 chart.
public void createChart(WinChartViewer viewer, int chartIndex)
{
//
// We use a random number generator to simulate the data from 9:30am to 4:30pm with
// one data point every 4 minutes. The total number of points during that period is
// 106. (7 hours x 15 points/hour + 1)
//
int noOfPoints = 106;
// Assume we have not reached the end of the day yet, and only 85 points are available.
// Create a random table object of 1 col x 85 rows, using 9 as seed.
RanTable rantable = new RanTable(9, 1, 85);
// Set the 1st column to start with 1800 and with random delta from -5 to 5.
rantable.setCol(0, 1800, -5, 5);
// Get the data as the 1st column of the random table
double[] data = rantable.getCol(0);
// The x-axis labels for the chart
string[] labels = {"-", "10am", "-", " ", "-", "12am", "-", " ", "-", "2pm", "-", " ",
"-", "4pm", "-"};
//
// Now we obtain the data into arrays, we can start to draw the chart using
// ChartDirector
//
// Create a XYChart object of size 180 x 180 pixels with a blue background (0x9c9cce)
XYChart c = new XYChart(180, 180, 0x9c9cce);
// Add titles to the top and bottom of the chart using 7.5pt Arial font. The text is
// white 0xffffff on a deep blue 0x31319C background.
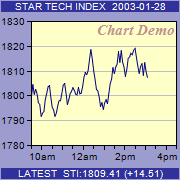
c.addTitle2(Chart.Top, "STAR TECH INDEX 2003-01-28", "Arial", 7.5, 0xffffff, 0x31319c);
c.addTitle2(Chart.Bottom, "LATEST STI:1809.41 (+14.51)", "Arial", 7.5, 0xffffff,
0x31319c);
// Set the plotarea at (31, 21) and of size 145 x 124 pixels, with a pale yellow
// (0xffffc8) background.
c.setPlotArea(31, 21, 145, 124, 0xffffc8);
// Add custom text at (176, 21) (top right corner of plotarea) using 11pt Times Bold
// Italic font/red (0xc09090) color
c.addText(176, 21, "Chart Demo", "Times New Roman Bold Italic", 11, 0xc09090
).setAlignment(Chart.TopRight);
// Use 7.5pt Arial as the y axis label font
c.yAxis().setLabelStyle("", 7.5);
// Set the labels on the x axis by spreading the labels evenly between the first point
// (index = 0) and the last point (index = noOfPoints - 1)
c.xAxis().setLinearScale(0, noOfPoints - 1, labels);
// Use 7.5pt Arial as the x axis label font
c.xAxis().setLabelStyle("", 7.5);
// Add a deep blue (0x000080) line layer to the chart
c.addLineLayer(data, 0x000080);
// Output the chart
viewer.Chart = c;
// Include tool tip for the chart. The chart starts at 9:30am and each point spans 240
// seconds, so we can compute the time as {x}*240+9.5*3600.
viewer.ImageMap = c.getHTMLImageMap("clickable", "",
"title='{={x}*240+9.5*3600|h:nna}: {value|2}'");
}
}
}
[Windows Forms - VB Version] NetWinCharts\VBNetWinCharts\compactline.vb
Imports System
Imports Microsoft.VisualBasic
Imports ChartDirector

Public Class compactline
    Implements DemoModule

    'Name of demo module
    Public Function getName() As String Implements DemoModule.getName
        Return "Compact Line Chart"
    End Function

    'Number of charts produced in this demo module
    Public Function getNoOfCharts() As Integer Implements DemoModule.getNoOfCharts
        Return 1
    End Function

    'Main code for creating chart.
    'Note: the argument chartIndex is unused because this demo only has 1 chart.
    Public Sub createChart(viewer As WinChartViewer, chartIndex As Integer) _
        Implements DemoModule.createChart

        '
        '    We use a random number generator to simulate the data from 9:30am to 4:30pm with one
        '    data point every 4 minutes. The total number of points during that period is 106.  (7
        '    hours x 15 points/hour + 1)
        '
        Dim noOfPoints As Integer = 106

        ' Assume we have not reached the end of the day yet, and only 85 points are available.
        ' Create a random table object of 1 col x 85 rows, using 9 as seed.
        Dim rantable As RanTable = New RanTable(9, 1, 85)

        ' Set the 1st column to start with 1800 and with random delta from -5 to 5.
        rantable.setCol(0, 1800, -5, 5)

        ' Get the data as the 1st column of the random table
        Dim data() As Double = rantable.getCol(0)

        ' The x-axis labels for the chart
        Dim labels() As String = {"-", "10am", "-", " ", "-", "12am", "-", " ", "-", "2pm", "-", _
            " ", "-", "4pm", "-"}

        '
        '    Now we obtain the data into arrays, we can start to draw the chart using ChartDirector
        '

        ' Create a XYChart object of size 180 x 180 pixels with a blue background (0x9c9cce)
        Dim c As XYChart = New XYChart(180, 180, &H9c9cce)

        ' Add titles to the top and bottom of the chart using 7.5pt Arial font. The text is white
        ' 0xffffff on a deep blue 0x31319C background.
        c.addTitle2(Chart.Top, "STAR TECH INDEX  2003-01-28", "Arial", 7.5, &Hffffff, &H31319c)
        c.addTitle2(Chart.Bottom, "LATEST  STI:1809.41 (+14.51)", "Arial", 7.5, &Hffffff, &H31319c)

        ' Set the plotarea at (31, 21) and of size 145 x 124 pixels, with a pale yellow (0xffffc8)
        ' background.
        c.setPlotArea(31, 21, 145, 124, &Hffffc8)

        ' Add custom text at (176, 21) (top right corner of plotarea) using 11pt Times Bold Italic
        ' font/red (0xc09090) color
        c.addText(176, 21, "Chart Demo", "Times New Roman Bold Italic", 11, &Hc09090 _
            ).setAlignment(Chart.TopRight)

        ' Use 7.5pt Arial as the y axis label font
        c.yAxis().setLabelStyle("", 7.5)

        ' Set the labels on the x axis by spreading the labels evenly between the first point (index
        ' = 0) and the last point (index = noOfPoints - 1)
        c.xAxis().setLinearScale(0, noOfPoints - 1, labels)

        ' Use 7.5pt Arial as the x axis label font
        c.xAxis().setLabelStyle("", 7.5)

        ' Add a deep blue (0x000080) line layer to the chart
        c.addLineLayer(data, &H000080)

        ' Output the chart
        viewer.Chart = c

        ' Include tool tip for the chart. The chart starts at 9:30am and each point spans 240
        ' seconds, so we can compute the time as {x}*240+9.5*3600.
        viewer.ImageMap = c.getHTMLImageMap("clickable", "", _
            "title='{={x}*240+9.5*3600|h:nna}: {value|2}'")

    End Sub

End Class
[WPF - C#] NetWPFCharts\CSharpWPFCharts\compactline.cs
using System;
using ChartDirector;

namespace CSharpWPFCharts
{
    public class compactline : DemoModule
    {
        //Name of demo module
        public string getName() { return "Compact Line Chart"; }

        //Number of charts produced in this demo module
        public int getNoOfCharts() { return 1; }

        //Main code for creating chart.
        //Note: the argument chartIndex is unused because this demo only has 1 chart.
        public void createChart(WPFChartViewer viewer, int chartIndex)
        {
            //
            //    We use a random number generator to simulate the data from 9:30am to 4:30pm with
            //    one data point every 4 minutes. The total number of points during that period is
            //    106.  (7 hours x 15 points/hour + 1)
            //
            int noOfPoints = 106;

            // Assume we have not reached the end of the day yet, and only 85 points are available.
            // Create a random table object of 1 col x 85 rows, using 9 as seed.
            RanTable rantable = new RanTable(9, 1, 85);

            // Set the 1st column to start with 1800 and with random delta from -5 to 5.
            rantable.setCol(0, 1800, -5, 5);

            // Get the data as the 1st column of the random table
            double[] data = rantable.getCol(0);

            // The x-axis labels for the chart
            string[] labels = {"-", "10am", "-", " ", "-", "12am", "-", " ", "-", "2pm", "-", " ",
                "-", "4pm", "-"};

            //
            //    Now we obtain the data into arrays, we can start to draw the chart using
            //    ChartDirector
            //

            // Create a XYChart object of size 180 x 180 pixels with a blue background (0x9c9cce)
            XYChart c = new XYChart(180, 180, 0x9c9cce);

            // Add titles to the top and bottom of the chart using 7.5pt Arial font. The text is
            // white 0xffffff on a deep blue 0x31319C background.
            c.addTitle2(Chart.Top, "STAR TECH INDEX  2003-01-28", "Arial", 7.5, 0xffffff, 0x31319c);
            c.addTitle2(Chart.Bottom, "LATEST  STI:1809.41 (+14.51)", "Arial", 7.5, 0xffffff,
                0x31319c);

            // Set the plotarea at (31, 21) and of size 145 x 124 pixels, with a pale yellow
            // (0xffffc8) background.
            c.setPlotArea(31, 21, 145, 124, 0xffffc8);

            // Add custom text at (176, 21) (top right corner of plotarea) using 11pt Times Bold
            // Italic font/red (0xc09090) color
            c.addText(176, 21, "Chart Demo", "Times New Roman Bold Italic", 11, 0xc09090
                ).setAlignment(Chart.TopRight);

            // Use 7.5pt Arial as the y axis label font
            c.yAxis().setLabelStyle("", 7.5);

            // Set the labels on the x axis by spreading the labels evenly between the first point
            // (index = 0) and the last point (index = noOfPoints - 1)
            c.xAxis().setLinearScale(0, noOfPoints - 1, labels);

            // Use 7.5pt Arial as the x axis label font
            c.xAxis().setLabelStyle("", 7.5);

            // Add a deep blue (0x000080) line layer to the chart
            c.addLineLayer(data, 0x000080);

            // Output the chart
            viewer.Chart = c;

            // Include tool tip for the chart. The chart starts at 9:30am and each point spans 240
            // seconds, so we can compute the time as {x}*240+9.5*3600.
            viewer.ImageMap = c.getHTMLImageMap("clickable", "",
                "title='{={x}*240+9.5*3600|h:nna}: {value|2}'");
        }
    }
}
[ASP.NET Web Forms - C# version] NetWebCharts\CSharpASP\compactline.aspx
(Click here on how to convert this code to code-behind style.)<%@ Page Language="C#" Debug="true" %>
<%@ Import Namespace="ChartDirector" %>
<%@ Register TagPrefix="chart" Namespace="ChartDirector" Assembly="netchartdir" %>
<!DOCTYPE html>
<script runat="server">
//
// Page Load event handler
//
protected void Page_Load(object sender, EventArgs e)
{
//
// We use a random number generator to simulate the data from 9:30am to 4:30pm with one data
// point every 4 minutes. The total number of points during that period is 106. (7 hours x
// 15 points/hour + 1)
//
int noOfPoints = 106;
// Assume we have not reached the end of the day yet, and only 85 points are available. Create a
// random table object of 1 col x 85 rows, using 9 as seed.
RanTable rantable = new RanTable(9, 1, 85);
// Set the 1st column to start with 1800 and with random delta from -5 to 5.
rantable.setCol(0, 1800, -5, 5);
// Get the data as the 1st column of the random table
double[] data = rantable.getCol(0);
// The x-axis labels for the chart
string[] labels = {"-", "10am", "-", " ", "-", "12am", "-", " ", "-", "2pm", "-", " ", "-",
"4pm", "-"};
//
// Now we obtain the data into arrays, we can start to draw the chart using ChartDirector
//
// Create a XYChart object of size 180 x 180 pixels with a blue background (0x9c9cce)
XYChart c = new XYChart(180, 180, 0x9c9cce);
// Add titles to the top and bottom of the chart using 7.5pt Arial font. The text is white
// 0xffffff on a deep blue 0x31319C background.
c.addTitle2(Chart.Top, "STAR TECH INDEX 2003-01-28", "Arial", 7.5, 0xffffff, 0x31319c);
c.addTitle2(Chart.Bottom, "LATEST STI:1809.41 (+14.51)", "Arial", 7.5, 0xffffff, 0x31319c);
// Set the plotarea at (31, 21) and of size 145 x 124 pixels, with a pale yellow (0xffffc8)
// background.
c.setPlotArea(31, 21, 145, 124, 0xffffc8);
// Add custom text at (176, 21) (top right corner of plotarea) using 11pt Times Bold Italic
// font/red (0xc09090) color
c.addText(176, 21, "Chart Demo", "Times New Roman Bold Italic", 11, 0xc09090).setAlignment(
Chart.TopRight);
// Use 7.5pt Arial as the y axis label font
c.yAxis().setLabelStyle("", 7.5);
// Set the labels on the x axis by spreading the labels evenly between the first point (index =
// 0) and the last point (index = noOfPoints - 1)
c.xAxis().setLinearScale(0, noOfPoints - 1, labels);
// Use 7.5pt Arial as the x axis label font
c.xAxis().setLabelStyle("", 7.5);
// Add a deep blue (0x000080) line layer to the chart
c.addLineLayer(data, 0x000080);
// Output the chart
WebChartViewer1.Image = c.makeWebImage(Chart.SVG);
// Include tool tip for the chart. The chart starts at 9:30am and each point spans 240 seconds,
// so we can compute the time as {x}*240+9.5*3600.
WebChartViewer1.ImageMap = c.getHTMLImageMap("", "",
"title='{={x}*240+9.5*3600|h:nna}: {value|2}'");
}
</script>
<html>
<head>
<script type="text/javascript" src="cdjcv.js"></script>
</head>
<body>
<chart:WebChartViewer id="WebChartViewer1" runat="server" />
</body>
</html>
[ASP.NET Web Forms - VB Version] NetWebCharts\VBNetASP\compactline.aspx
(Click here on how to convert this code to code-behind style.)<%@ Page Language="VB" Debug="true" %>
<%@ Import Namespace="ChartDirector" %>
<%@ Register TagPrefix="chart" Namespace="ChartDirector" Assembly="netchartdir" %>
<!DOCTYPE html>
<script runat="server">
'
' Page Load event handler
'
Protected Sub Page_Load(ByVal sender As System.Object, ByVal e As System.EventArgs)
'
' We use a random number generator to simulate the data from 9:30am to 4:30pm with one data
' point every 4 minutes. The total number of points during that period is 106. (7 hours x 15
' points/hour + 1)
'
Dim noOfPoints As Integer = 106
' Assume we have not reached the end of the day yet, and only 85 points are available. Create a
' random table object of 1 col x 85 rows, using 9 as seed.
Dim rantable As RanTable = New RanTable(9, 1, 85)
' Set the 1st column to start with 1800 and with random delta from -5 to 5.
rantable.setCol(0, 1800, -5, 5)
' Get the data as the 1st column of the random table
Dim data() As Double = rantable.getCol(0)
' The x-axis labels for the chart
Dim labels() As String = {"-", "10am", "-", " ", "-", "12am", "-", " ", "-", "2pm", "-", " ", _
"-", "4pm", "-"}
'
' Now we obtain the data into arrays, we can start to draw the chart using ChartDirector
'
' Create a XYChart object of size 180 x 180 pixels with a blue background (0x9c9cce)
Dim c As XYChart = New XYChart(180, 180, &H9c9cce)
' Add titles to the top and bottom of the chart using 7.5pt Arial font. The text is white
' 0xffffff on a deep blue 0x31319C background.
c.addTitle2(Chart.Top, "STAR TECH INDEX 2003-01-28", "Arial", 7.5, &Hffffff, &H31319c)
c.addTitle2(Chart.Bottom, "LATEST STI:1809.41 (+14.51)", "Arial", 7.5, &Hffffff, &H31319c)
' Set the plotarea at (31, 21) and of size 145 x 124 pixels, with a pale yellow (0xffffc8)
' background.
c.setPlotArea(31, 21, 145, 124, &Hffffc8)
' Add custom text at (176, 21) (top right corner of plotarea) using 11pt Times Bold Italic
' font/red (0xc09090) color
c.addText(176, 21, "Chart Demo", "Times New Roman Bold Italic", 11, &Hc09090).setAlignment( _
Chart.TopRight)
' Use 7.5pt Arial as the y axis label font
c.yAxis().setLabelStyle("", 7.5)
' Set the labels on the x axis by spreading the labels evenly between the first point (index =
' 0) and the last point (index = noOfPoints - 1)
c.xAxis().setLinearScale(0, noOfPoints - 1, labels)
' Use 7.5pt Arial as the x axis label font
c.xAxis().setLabelStyle("", 7.5)
' Add a deep blue (0x000080) line layer to the chart
c.addLineLayer(data, &H000080)
' Output the chart
WebChartViewer1.Image = c.makeWebImage(Chart.SVG)
' Include tool tip for the chart. The chart starts at 9:30am and each point spans 240 seconds,
' so we can compute the time as {x}*240+9.5*3600.
WebChartViewer1.ImageMap = c.getHTMLImageMap("", "", _
"title='{={x}*240+9.5*3600|h:nna}: {value|2}'")
End Sub
</script>
<html>
<head>
<script type="text/javascript" src="cdjcv.js"></script>
</head>
<body>
<chart:WebChartViewer id="WebChartViewer1" runat="server" />
</body>
</html>
[ASP.NET MVC - Controller] NetMvcCharts\Controllers\CompactlineController.cs
using System;
using System.Web.Mvc;
using ChartDirector;

namespace NetMvcCharts.Controllers
{
    public class CompactlineController : Controller
    {
        //
        // Default Action
        //
        public ActionResult Index()
        {
            ViewBag.Title = "Compact Line Chart";
            createChart(ViewBag.Viewer = new RazorChartViewer(HttpContext, "chart1"));
            return View("~/Views/Shared/ChartView.cshtml");
        }

        //
        // Create chart
        //
        private void createChart(RazorChartViewer viewer)
        {
            //
            //    We use a random number generator to simulate the data from 9:30am to 4:30pm with one
            //    data point every 4 minutes. The total number of points during that period is 106.  (7
            //    hours x 15 points/hour + 1)
            //
            int noOfPoints = 106;

            // Assume we have not reached the end of the day yet, and only 85 points are available.
            // Create a random table object of 1 col x 85 rows, using 9 as seed.
            RanTable rantable = new RanTable(9, 1, 85);

            // Set the 1st column to start with 1800 and with random delta from -5 to 5.
            rantable.setCol(0, 1800, -5, 5);

            // Get the data as the 1st column of the random table
            double[] data = rantable.getCol(0);

            // The x-axis labels for the chart
            string[] labels = {"-", "10am", "-", " ", "-", "12am", "-", " ", "-", "2pm", "-", " ", "-",
                "4pm", "-"};

            //
            //    Now we obtain the data into arrays, we can start to draw the chart using ChartDirector
            //

            // Create a XYChart object of size 180 x 180 pixels with a blue background (0x9c9cce)
            XYChart c = new XYChart(180, 180, 0x9c9cce);

            // Add titles to the top and bottom of the chart using 7.5pt Arial font. The text is white
            // 0xffffff on a deep blue 0x31319C background.
            c.addTitle2(Chart.Top, "STAR TECH INDEX  2003-01-28", "Arial", 7.5, 0xffffff, 0x31319c);
            c.addTitle2(Chart.Bottom, "LATEST  STI:1809.41 (+14.51)", "Arial", 7.5, 0xffffff, 0x31319c);

            // Set the plotarea at (31, 21) and of size 145 x 124 pixels, with a pale yellow (0xffffc8)
            // background.
            c.setPlotArea(31, 21, 145, 124, 0xffffc8);

            // Add custom text at (176, 21) (top right corner of plotarea) using 11pt Times Bold Italic
            // font/red (0xc09090) color
            c.addText(176, 21, "Chart Demo", "Times New Roman Bold Italic", 11, 0xc09090).setAlignment(
                Chart.TopRight);

            // Use 7.5pt Arial as the y axis label font
            c.yAxis().setLabelStyle("", 7.5);

            // Set the labels on the x axis by spreading the labels evenly between the first point (index
            // = 0) and the last point (index = noOfPoints - 1)
            c.xAxis().setLinearScale(0, noOfPoints - 1, labels);

            // Use 7.5pt Arial as the x axis label font
            c.xAxis().setLabelStyle("", 7.5);

            // Add a deep blue (0x000080) line layer to the chart
            c.addLineLayer(data, 0x000080);

            // Output the chart
            viewer.Image = c.makeWebImage(Chart.SVG);

            // Include tool tip for the chart. The chart starts at 9:30am and each point spans 240
            // seconds, so we can compute the time as {x}*240+9.5*3600.
            viewer.ImageMap = c.getHTMLImageMap("", "",
                "title='{={x}*240+9.5*3600|h:nna}: {value|2}'");
        }
    }
}
[ASP.NET MVC - View] NetMvcCharts\Views\Shared\ChartView.cshtml
@{ Layout = null; }

<!DOCTYPE html>

<html>
<head>
    <meta name="viewport" content="width=device-width" />
    <title>@ViewBag.Title</title>
    <style>
        @ViewBag.Style
    </style>
    @Scripts.Render("~/Scripts/cdjcv.js")
</head>
<body style="margin:5px 0px 0px 5px">
    <div style="font:bold 18pt verdana;">
        @ViewBag.Title
    </div>
    <hr style="border:solid 1px #000080; background:#000080" />
    <div>
        @{
            if (ViewBag.Viewer is Array)
            {
                // Display multiple charts
                for (int i = 0; i < ViewBag.Viewer.Length; ++i)
                {
                    @:@Html.Raw(ViewBag.Viewer[i].RenderHTML())
                }
            }
            else
            {
                // Display one chart only
                @:@Html.Raw(ViewBag.Viewer.RenderHTML())
            }
        }
    </div>
</body>
</html>
© 2023 Advanced Software Engineering Limited. All rights reserved.