[Windows Forms - C# version] NetWinCharts\CSharpWinCharts\concentric.cs
using System;
using ChartDirector;
namespace CSharpChartExplorer
{
public class concentric : DemoModule
{
//Name of demo module
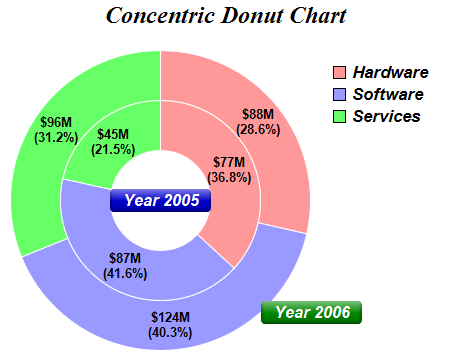
public string getName() { return "Concentric Donut Chart"; }
//Number of charts produced in this demo module
public int getNoOfCharts() { return 1; }
//Main code for creating chart.
//Note: the argument chartIndex is unused because this demo only has 1 chart.
public void createChart(WinChartViewer viewer, int chartIndex)
{
// Data for outer ring
double[] data = {88, 124, 96};
// Data for inner ring
double[] data2 = {77, 87, 45};
// Labels for the sectors
string[] labels = {"Hardware", "Software", "Services"};
// Colors for the sectors
int[] colors = {0xff9999, 0x9999ff, 0x66ff66};
//
// Create the main chart, which contains the chart title, the outer ring, and the legend
// box
//
// Create a PieChart object of size 450 x 360 pixels, with transparent background
PieChart c = new PieChart(450, 360);
// Add a title to the chart with 18pt Times Bold Italic font
c.addTitle("Concentric Donut Chart", "Times New Roman Bold Italic", 18);
// Set donut center at (160, 200), and outer/inner radii as 150/100 pixels
c.setDonutSize(160, 200, 150, 100);
// Add a label at the bottom-right corner of the ring to label the outer ring Use 12pt
// Arial Bold Italic font in white (ffffff) color, on a green (008800) background, with
// soft lighting effect and 5 pixels rounded corners
ChartDirector.TextBox t = c.addText(260, 300, " Year 2006 ", "Arial Bold Italic", 12,
0xffffff);
t.setBackground(0x008800, Chart.Transparent, Chart.softLighting());
t.setRoundedCorners(5);
// Set the legend box at (320, 50) with 12pt Arial Bold Italic font, with no border
c.addLegend(320, 50, true, "Arial Bold Italic", 13).setBackground(Chart.Transparent,
Chart.Transparent);
// Set the pie data and the pie labels
c.setData(data, labels);
// Set the pie colors
c.setColors2(Chart.DataColor, colors);
// Set pie border color to white (ffffff)
c.setLineColor(0xffffff);
// Set pie label to value in $###M format, percentage in (##.#%) format, in two lines.
c.setLabelFormat("${value}M<*br*>({percent|1}%)");
// Use 10pt Airal Bold for the sector labels
c.setLabelStyle("Arial Bold", 10);
// Set the label position to -25 pixels from the sector (which would be internal to the
// sector)
c.setLabelPos(-25);
//
// Create the inner ring.
//
// Create a PieChart object of size 280 x 320 pixels, with transparent background
PieChart c2 = new PieChart(280, 320, Chart.Transparent);
// Set donut center at (110, 110), and outer/inner radii as 100/50 pixels
c2.setDonutSize(110, 110, 100, 50);
// Add a label at the center of the ring to label the inner ring. Use 12pt Arial Bold
// Italic font in white (ffffff) color, on a deep blue (0000cc) background, with soft
// lighting effect and 5 pixels rounded corners
ChartDirector.TextBox t2 = c2.addText(110, 110, " Year 2005 ", "Arial Bold Italic", 12,
0xffffff, Chart.Center);
t2.setBackground(0x0000cc, Chart.Transparent, Chart.softLighting());
t2.setRoundedCorners(5);
// Set the pie data and the pie labels
c2.setData(data2, labels);
// Set the pie colors
c2.setColors2(Chart.DataColor, colors);
// Set pie border color to white (ffffff)
c2.setLineColor(0xffffff);
// Set pie label to value in $###M format, percentage in (##.#%) format, in two lines.
c2.setLabelFormat("${value}M<*br*>({percent|1}%)");
// Use 10pt Airal Bold for the sector labels
c2.setLabelStyle("Arial Bold", 10);
// Set the label position to -25 pixels from the sector (which would be internal to the
// sector)
c2.setLabelPos(-25);
// merge the inner ring into the outer ring at (50, 90)
c.makeChart3().merge(c2.makeChart3(), 50, 90, Chart.TopLeft, 0);
// Output the chart
viewer.Chart = c;
// include tool tip for the chart
viewer.ImageMap = c2.getHTMLImageMap("clickable", "",
"title='{label} revenue for 2005: US${value}M ({percent}%)'", 50, 90) +
c.getHTMLImageMap("clickable", "",
"title='{label} revenue for 2006: US${value}M ({percent}%)'");
}
}
}
[Windows Forms - VB Version] NetWinCharts\VBNetWinCharts\concentric.vb
Imports System
Imports Microsoft.VisualBasic
Imports ChartDirector

Public Class concentric
    Implements DemoModule

    'Name of demo module
    Public Function getName() As String Implements DemoModule.getName
        Return "Concentric Donut Chart"
    End Function

    'Number of charts produced in this demo module
    Public Function getNoOfCharts() As Integer Implements DemoModule.getNoOfCharts
        Return 1
    End Function

    'Main code for creating chart.
    'Note: the argument chartIndex is unused because this demo only has 1 chart.
    Public Sub createChart(viewer As WinChartViewer, chartIndex As Integer) _
        Implements DemoModule.createChart

        ' Data for outer ring
        Dim data() As Double = {88, 124, 96}

        ' Data for inner ring
        Dim data2() As Double = {77, 87, 45}

        ' Labels for the sectors
        Dim labels() As String = {"Hardware", "Software", "Services"}

        ' Colors for the sectors
        Dim colors() As Integer = {&Hff9999, &H9999ff, &H66ff66}

        '
        ' Create the main chart, which contains the chart title, the outer ring, and the legend box
        '

        ' Create a PieChart object of size 450 x 360 pixels, with transparent background
        Dim c As PieChart = New PieChart(450, 360)

        ' Add a title to the chart with 18pt Times Bold Italic font
        c.addTitle("Concentric Donut Chart", "Times New Roman Bold Italic", 18)

        ' Set donut center at (160, 200), and outer/inner radii as 150/100 pixels
        c.setDonutSize(160, 200, 150, 100)

        ' Add a label at the bottom-right corner of the ring to label the outer ring Use 12pt Arial
        ' Bold Italic font in white (ffffff) color, on a green (008800) background, with soft
        ' lighting effect and 5 pixels rounded corners
        Dim t As ChartDirector.TextBox = c.addText(260, 300, " Year 2006 ", "Arial Bold Italic", _
            12, &Hffffff)
        t.setBackground(&H008800, Chart.Transparent, Chart.softLighting())
        t.setRoundedCorners(5)

        ' Set the legend box at (320, 50) with 12pt Arial Bold Italic font, with no border
        c.addLegend(320, 50, True, "Arial Bold Italic", 13).setBackground(Chart.Transparent, _
            Chart.Transparent)

        ' Set the pie data and the pie labels
        c.setData(data, labels)

        ' Set the pie colors
        c.setColors2(Chart.DataColor, colors)

        ' Set pie border color to white (ffffff)
        c.setLineColor(&Hffffff)

        ' Set pie label to value in $###M format, percentage in (##.#%) format, in two lines.
        c.setLabelFormat("${value}M<*br*>({percent|1}%)")

        ' Use 10pt Airal Bold for the sector labels
        c.setLabelStyle("Arial Bold", 10)

        ' Set the label position to -25 pixels from the sector (which would be internal to the
        ' sector)
        c.setLabelPos(-25)

        '
        ' Create the inner ring.
        '

        ' Create a PieChart object of size 280 x 320 pixels, with transparent background
        Dim c2 As PieChart = New PieChart(280, 320, Chart.Transparent)

        ' Set donut center at (110, 110), and outer/inner radii as 100/50 pixels
        c2.setDonutSize(110, 110, 100, 50)

        ' Add a label at the center of the ring to label the inner ring. Use 12pt Arial Bold Italic
        ' font in white (ffffff) color, on a deep blue (0000cc) background, with soft lighting
        ' effect and 5 pixels rounded corners
        Dim t2 As ChartDirector.TextBox = c2.addText(110, 110, " Year 2005 ", "Arial Bold Italic", _
            12, &Hffffff, Chart.Center)
        t2.setBackground(&H0000cc, Chart.Transparent, Chart.softLighting())
        t2.setRoundedCorners(5)

        ' Set the pie data and the pie labels
        c2.setData(data2, labels)

        ' Set the pie colors
        c2.setColors2(Chart.DataColor, colors)

        ' Set pie border color to white (ffffff)
        c2.setLineColor(&Hffffff)

        ' Set pie label to value in $###M format, percentage in (##.#%) format, in two lines.
        c2.setLabelFormat("${value}M<*br*>({percent|1}%)")

        ' Use 10pt Airal Bold for the sector labels
        c2.setLabelStyle("Arial Bold", 10)

        ' Set the label position to -25 pixels from the sector (which would be internal to the
        ' sector)
        c2.setLabelPos(-25)

        ' merge the inner ring into the outer ring at (50, 90)
        c.makeChart3().merge(c2.makeChart3(), 50, 90, Chart.TopLeft, 0)

        ' Output the chart
        viewer.Chart = c

        ' include tool tip for the chart
        viewer.ImageMap = c2.getHTMLImageMap("clickable", "", _
            "title='{label} revenue for 2005: US${value}M ({percent}%)'", 50, 90) + _
            c.getHTMLImageMap("clickable", "", _
            "title='{label} revenue for 2006: US${value}M ({percent}%)'")

    End Sub

End Class
[WPF - C#] NetWPFCharts\CSharpWPFCharts\concentric.cs
using System;
using ChartDirector;

namespace CSharpWPFCharts
{
    public class concentric : DemoModule
    {
        //Name of demo module
        public string getName() { return "Concentric Donut Chart"; }

        //Number of charts produced in this demo module
        public int getNoOfCharts() { return 1; }

        //Main code for creating chart.
        //Note: the argument chartIndex is unused because this demo only has 1 chart.
        public void createChart(WPFChartViewer viewer, int chartIndex)
        {
            // Data for outer ring
            double[] data = {88, 124, 96};

            // Data for inner ring
            double[] data2 = {77, 87, 45};

            // Labels for the sectors
            string[] labels = {"Hardware", "Software", "Services"};

            // Colors for the sectors
            int[] colors = {0xff9999, 0x9999ff, 0x66ff66};

            //
            // Create the main chart, which contains the chart title, the outer ring, and the legend
            // box
            //

            // Create a PieChart object of size 450 x 360 pixels, with transparent background
            PieChart c = new PieChart(450, 360);

            // Add a title to the chart with 18pt Times Bold Italic font
            c.addTitle("Concentric Donut Chart", "Times New Roman Bold Italic", 18);

            // Set donut center at (160, 200), and outer/inner radii as 150/100 pixels
            c.setDonutSize(160, 200, 150, 100);

            // Add a label at the bottom-right corner of the ring to label the outer ring Use 12pt
            // Arial Bold Italic font in white (ffffff) color, on a green (008800) background, with
            // soft lighting effect and 5 pixels rounded corners
            ChartDirector.TextBox t = c.addText(260, 300, " Year 2006 ", "Arial Bold Italic", 12,
                0xffffff);
            t.setBackground(0x008800, Chart.Transparent, Chart.softLighting());
            t.setRoundedCorners(5);

            // Set the legend box at (320, 50) with 12pt Arial Bold Italic font, with no border
            c.addLegend(320, 50, true, "Arial Bold Italic", 13).setBackground(Chart.Transparent,
                Chart.Transparent);

            // Set the pie data and the pie labels
            c.setData(data, labels);

            // Set the pie colors
            c.setColors2(Chart.DataColor, colors);

            // Set pie border color to white (ffffff)
            c.setLineColor(0xffffff);

            // Set pie label to value in $###M format, percentage in (##.#%) format, in two lines.
            c.setLabelFormat("${value}M<*br*>({percent|1}%)");

            // Use 10pt Airal Bold for the sector labels
            c.setLabelStyle("Arial Bold", 10);

            // Set the label position to -25 pixels from the sector (which would be internal to the
            // sector)
            c.setLabelPos(-25);

            //
            // Create the inner ring.
            //

            // Create a PieChart object of size 280 x 320 pixels, with transparent background
            PieChart c2 = new PieChart(280, 320, Chart.Transparent);

            // Set donut center at (110, 110), and outer/inner radii as 100/50 pixels
            c2.setDonutSize(110, 110, 100, 50);

            // Add a label at the center of the ring to label the inner ring. Use 12pt Arial Bold
            // Italic font in white (ffffff) color, on a deep blue (0000cc) background, with soft
            // lighting effect and 5 pixels rounded corners
            ChartDirector.TextBox t2 = c2.addText(110, 110, " Year 2005 ", "Arial Bold Italic", 12,
                0xffffff, Chart.Center);
            t2.setBackground(0x0000cc, Chart.Transparent, Chart.softLighting());
            t2.setRoundedCorners(5);

            // Set the pie data and the pie labels
            c2.setData(data2, labels);

            // Set the pie colors
            c2.setColors2(Chart.DataColor, colors);

            // Set pie border color to white (ffffff)
            c2.setLineColor(0xffffff);

            // Set pie label to value in $###M format, percentage in (##.#%) format, in two lines.
            c2.setLabelFormat("${value}M<*br*>({percent|1}%)");

            // Use 10pt Airal Bold for the sector labels
            c2.setLabelStyle("Arial Bold", 10);

            // Set the label position to -25 pixels from the sector (which would be internal to the
            // sector)
            c2.setLabelPos(-25);

            // merge the inner ring into the outer ring at (50, 90)
            c.makeChart3().merge(c2.makeChart3(), 50, 90, Chart.TopLeft, 0);

            // Output the chart
            viewer.Chart = c;

            // include tool tip for the chart
            viewer.ImageMap = c2.getHTMLImageMap("clickable", "",
                "title='{label} revenue for 2005: US${value}M ({percent}%)'", 50, 90) +
                c.getHTMLImageMap("clickable", "",
                "title='{label} revenue for 2006: US${value}M ({percent}%)'");
        }
    }
}
[ASP.NET Web Forms - C# version] NetWebCharts\CSharpASP\concentric.aspx
(Click here on how to convert this code to code-behind style.)<%@ Page Language="C#" Debug="true" %>
<%@ Import Namespace="ChartDirector" %>
<%@ Register TagPrefix="chart" Namespace="ChartDirector" Assembly="netchartdir" %>
<!DOCTYPE html>
<script runat="server">
//
// Page Load event handler
//
protected void Page_Load(object sender, EventArgs e)
{
// Data for outer ring
double[] data = {88, 124, 96};
// Data for inner ring
double[] data2 = {77, 87, 45};
// Labels for the sectors
string[] labels = {"Hardware", "Software", "Services"};
// Colors for the sectors
int[] colors = {0xff9999, 0x9999ff, 0x66ff66};
//
// Create the main chart, which contains the chart title, the outer ring, and the legend box
//
// Create a PieChart object of size 450 x 360 pixels, with transparent background
PieChart c = new PieChart(450, 360);
// Add a title to the chart with 18pt Times Bold Italic font
c.addTitle("Concentric Donut Chart", "Times New Roman Bold Italic", 18);
// Set donut center at (160, 200), and outer/inner radii as 150/100 pixels
c.setDonutSize(160, 200, 150, 100);
// Add a label at the bottom-right corner of the ring to label the outer ring Use 12pt Arial
// Bold Italic font in white (ffffff) color, on a green (008800) background, with soft lighting
// effect and 5 pixels rounded corners
ChartDirector.TextBox t = c.addText(260, 300, " Year 2006 ", "Arial Bold Italic", 12, 0xffffff);
t.setBackground(0x008800, Chart.Transparent, Chart.softLighting());
t.setRoundedCorners(5);
// Set the legend box at (320, 50) with 12pt Arial Bold Italic font, with no border
c.addLegend(320, 50, true, "Arial Bold Italic", 13).setBackground(Chart.Transparent,
Chart.Transparent);
// Set the pie data and the pie labels
c.setData(data, labels);
// Set the pie colors
c.setColors2(Chart.DataColor, colors);
// Set pie border color to white (ffffff)
c.setLineColor(0xffffff);
// Set pie label to value in $###M format, percentage in (##.#%) format, in two lines.
c.setLabelFormat("${value}M<*br*>({percent|1}%)");
// Use 10pt Airal Bold for the sector labels
c.setLabelStyle("Arial Bold", 10);
// Set the label position to -25 pixels from the sector (which would be internal to the sector)
c.setLabelPos(-25);
//
// Create the inner ring.
//
// Create a PieChart object of size 280 x 320 pixels, with transparent background
PieChart c2 = new PieChart(280, 320, Chart.Transparent);
// Set donut center at (110, 110), and outer/inner radii as 100/50 pixels
c2.setDonutSize(110, 110, 100, 50);
// Add a label at the center of the ring to label the inner ring. Use 12pt Arial Bold Italic
// font in white (ffffff) color, on a deep blue (0000cc) background, with soft lighting effect
// and 5 pixels rounded corners
ChartDirector.TextBox t2 = c2.addText(110, 110, " Year 2005 ", "Arial Bold Italic", 12,
0xffffff, Chart.Center);
t2.setBackground(0x0000cc, Chart.Transparent, Chart.softLighting());
t2.setRoundedCorners(5);
// Set the pie data and the pie labels
c2.setData(data2, labels);
// Set the pie colors
c2.setColors2(Chart.DataColor, colors);
// Set pie border color to white (ffffff)
c2.setLineColor(0xffffff);
// Set pie label to value in $###M format, percentage in (##.#%) format, in two lines.
c2.setLabelFormat("${value}M<*br*>({percent|1}%)");
// Use 10pt Airal Bold for the sector labels
c2.setLabelStyle("Arial Bold", 10);
// Set the label position to -25 pixels from the sector (which would be internal to the sector)
c2.setLabelPos(-25);
// merge the inner ring into the outer ring at (50, 90)
c.makeChart3().merge(c2.makeChart3(), 50, 90, Chart.TopLeft, 0);
// Output the chart
WebChartViewer1.Image = c.makeWebImage(Chart.SVG);
// include tool tip for the chart
WebChartViewer1.ImageMap = c2.getHTMLImageMap("", "",
"title='{label} revenue for 2005: US${value}M ({percent}%)'", 50, 90) + c.getHTMLImageMap(
"", "", "title='{label} revenue for 2006: US${value}M ({percent}%)'");
}
</script>
<html>
<head>
<script type="text/javascript" src="cdjcv.js"></script>
</head>
<body>
<chart:WebChartViewer id="WebChartViewer1" runat="server" />
</body>
</html>
[ASP.NET Web Forms - VB Version] NetWebCharts\VBNetASP\concentric.aspx
(Click here on how to convert this code to code-behind style.)<%@ Page Language="VB" Debug="true" %>
<%@ Import Namespace="ChartDirector" %>
<%@ Register TagPrefix="chart" Namespace="ChartDirector" Assembly="netchartdir" %>
<!DOCTYPE html>
<script runat="server">
'
' Page Load event handler
'
Protected Sub Page_Load(ByVal sender As System.Object, ByVal e As System.EventArgs)
' Data for outer ring
Dim data() As Double = {88, 124, 96}
' Data for inner ring
Dim data2() As Double = {77, 87, 45}
' Labels for the sectors
Dim labels() As String = {"Hardware", "Software", "Services"}
' Colors for the sectors
Dim colors() As Integer = {&Hff9999, &H9999ff, &H66ff66}
'
' Create the main chart, which contains the chart title, the outer ring, and the legend box
'
' Create a PieChart object of size 450 x 360 pixels, with transparent background
Dim c As PieChart = New PieChart(450, 360)
' Add a title to the chart with 18pt Times Bold Italic font
c.addTitle("Concentric Donut Chart", "Times New Roman Bold Italic", 18)
' Set donut center at (160, 200), and outer/inner radii as 150/100 pixels
c.setDonutSize(160, 200, 150, 100)
' Add a label at the bottom-right corner of the ring to label the outer ring Use 12pt Arial Bold
' Italic font in white (ffffff) color, on a green (008800) background, with soft lighting effect
' and 5 pixels rounded corners
Dim t As ChartDirector.TextBox = c.addText(260, 300, " Year 2006 ", "Arial Bold Italic", 12, _
&Hffffff)
t.setBackground(&H008800, Chart.Transparent, Chart.softLighting())
t.setRoundedCorners(5)
' Set the legend box at (320, 50) with 12pt Arial Bold Italic font, with no border
c.addLegend(320, 50, True, "Arial Bold Italic", 13).setBackground(Chart.Transparent, _
Chart.Transparent)
' Set the pie data and the pie labels
c.setData(data, labels)
' Set the pie colors
c.setColors2(Chart.DataColor, colors)
' Set pie border color to white (ffffff)
c.setLineColor(&Hffffff)
' Set pie label to value in $###M format, percentage in (##.#%) format, in two lines.
c.setLabelFormat("${value}M<*br*>({percent|1}%)")
' Use 10pt Airal Bold for the sector labels
c.setLabelStyle("Arial Bold", 10)
' Set the label position to -25 pixels from the sector (which would be internal to the sector)
c.setLabelPos(-25)
'
' Create the inner ring.
'
' Create a PieChart object of size 280 x 320 pixels, with transparent background
Dim c2 As PieChart = New PieChart(280, 320, Chart.Transparent)
' Set donut center at (110, 110), and outer/inner radii as 100/50 pixels
c2.setDonutSize(110, 110, 100, 50)
' Add a label at the center of the ring to label the inner ring. Use 12pt Arial Bold Italic font
' in white (ffffff) color, on a deep blue (0000cc) background, with soft lighting effect and 5
' pixels rounded corners
Dim t2 As ChartDirector.TextBox = c2.addText(110, 110, " Year 2005 ", "Arial Bold Italic", 12, _
&Hffffff, Chart.Center)
t2.setBackground(&H0000cc, Chart.Transparent, Chart.softLighting())
t2.setRoundedCorners(5)
' Set the pie data and the pie labels
c2.setData(data2, labels)
' Set the pie colors
c2.setColors2(Chart.DataColor, colors)
' Set pie border color to white (ffffff)
c2.setLineColor(&Hffffff)
' Set pie label to value in $###M format, percentage in (##.#%) format, in two lines.
c2.setLabelFormat("${value}M<*br*>({percent|1}%)")
' Use 10pt Airal Bold for the sector labels
c2.setLabelStyle("Arial Bold", 10)
' Set the label position to -25 pixels from the sector (which would be internal to the sector)
c2.setLabelPos(-25)
' merge the inner ring into the outer ring at (50, 90)
c.makeChart3().merge(c2.makeChart3(), 50, 90, Chart.TopLeft, 0)
' Output the chart
WebChartViewer1.Image = c.makeWebImage(Chart.SVG)
' include tool tip for the chart
WebChartViewer1.ImageMap = c2.getHTMLImageMap("", "", _
"title='{label} revenue for 2005: US${value}M ({percent}%)'", 50, 90) + c.getHTMLImageMap( _
"", "", "title='{label} revenue for 2006: US${value}M ({percent}%)'")
End Sub
</script>
<html>
<head>
<script type="text/javascript" src="cdjcv.js"></script>
</head>
<body>
<chart:WebChartViewer id="WebChartViewer1" runat="server" />
</body>
</html>
[ASP.NET MVC - Controller] NetMvcCharts\Controllers\ConcentricController.cs
using System;
using System.Web.Mvc;
using ChartDirector;

namespace NetMvcCharts.Controllers
{
    public class ConcentricController : Controller
    {
        //
        // Default Action
        //
        public ActionResult Index()
        {
            ViewBag.Title = "Concentric Donut Chart";
            createChart(ViewBag.Viewer = new RazorChartViewer(HttpContext, "chart1"));
            return View("~/Views/Shared/ChartView.cshtml");
        }

        //
        // Create chart
        //
        private void createChart(RazorChartViewer viewer)
        {
            // Data for outer ring
            double[] data = {88, 124, 96};

            // Data for inner ring
            double[] data2 = {77, 87, 45};

            // Labels for the sectors
            string[] labels = {"Hardware", "Software", "Services"};

            // Colors for the sectors
            int[] colors = {0xff9999, 0x9999ff, 0x66ff66};

            //
            // Create the main chart, which contains the chart title, the outer ring, and the legend box
            //

            // Create a PieChart object of size 450 x 360 pixels, with transparent background
            PieChart c = new PieChart(450, 360);

            // Add a title to the chart with 18pt Times Bold Italic font
            c.addTitle("Concentric Donut Chart", "Times New Roman Bold Italic", 18);

            // Set donut center at (160, 200), and outer/inner radii as 150/100 pixels
            c.setDonutSize(160, 200, 150, 100);

            // Add a label at the bottom-right corner of the ring to label the outer ring Use 12pt Arial
            // Bold Italic font in white (ffffff) color, on a green (008800) background, with soft
            // lighting effect and 5 pixels rounded corners
            ChartDirector.TextBox t = c.addText(260, 300, " Year 2006 ", "Arial Bold Italic", 12,
                0xffffff);
            t.setBackground(0x008800, Chart.Transparent, Chart.softLighting());
            t.setRoundedCorners(5);

            // Set the legend box at (320, 50) with 12pt Arial Bold Italic font, with no border
            c.addLegend(320, 50, true, "Arial Bold Italic", 13).setBackground(Chart.Transparent,
                Chart.Transparent);

            // Set the pie data and the pie labels
            c.setData(data, labels);

            // Set the pie colors
            c.setColors2(Chart.DataColor, colors);

            // Set pie border color to white (ffffff)
            c.setLineColor(0xffffff);

            // Set pie label to value in $###M format, percentage in (##.#%) format, in two lines.
            c.setLabelFormat("${value}M<*br*>({percent|1}%)");

            // Use 10pt Airal Bold for the sector labels
            c.setLabelStyle("Arial Bold", 10);

            // Set the label position to -25 pixels from the sector (which would be internal to the
            // sector)
            c.setLabelPos(-25);

            //
            // Create the inner ring.
            //

            // Create a PieChart object of size 280 x 320 pixels, with transparent background
            PieChart c2 = new PieChart(280, 320, Chart.Transparent);

            // Set donut center at (110, 110), and outer/inner radii as 100/50 pixels
            c2.setDonutSize(110, 110, 100, 50);

            // Add a label at the center of the ring to label the inner ring. Use 12pt Arial Bold Italic
            // font in white (ffffff) color, on a deep blue (0000cc) background, with soft lighting
            // effect and 5 pixels rounded corners
            ChartDirector.TextBox t2 = c2.addText(110, 110, " Year 2005 ", "Arial Bold Italic", 12,
                0xffffff, Chart.Center);
            t2.setBackground(0x0000cc, Chart.Transparent, Chart.softLighting());
            t2.setRoundedCorners(5);

            // Set the pie data and the pie labels
            c2.setData(data2, labels);

            // Set the pie colors
            c2.setColors2(Chart.DataColor, colors);

            // Set pie border color to white (ffffff)
            c2.setLineColor(0xffffff);

            // Set pie label to value in $###M format, percentage in (##.#%) format, in two lines.
            c2.setLabelFormat("${value}M<*br*>({percent|1}%)");

            // Use 10pt Airal Bold for the sector labels
            c2.setLabelStyle("Arial Bold", 10);

            // Set the label position to -25 pixels from the sector (which would be internal to the
            // sector)
            c2.setLabelPos(-25);

            // merge the inner ring into the outer ring at (50, 90)
            c.makeChart3().merge(c2.makeChart3(), 50, 90, Chart.TopLeft, 0);

            // Output the chart
            viewer.Image = c.makeWebImage(Chart.SVG);

            // include tool tip for the chart
            viewer.ImageMap = c2.getHTMLImageMap("", "",
                "title='{label} revenue for 2005: US${value}M ({percent}%)'", 50, 90) +
                c.getHTMLImageMap("", "", "title='{label} revenue for 2006: US${value}M ({percent}%)'");
        }
    }
}
[ASP.NET MVC - View] NetMvcCharts\Views\Shared\ChartView.cshtml
@{ Layout = null; }

<!DOCTYPE html>

<html>
<head>
    <meta name="viewport" content="width=device-width" />
    <title>@ViewBag.Title</title>
    <style>
        @ViewBag.Style
    </style>
    @Scripts.Render("~/Scripts/cdjcv.js")
</head>
<body style="margin:5px 0px 0px 5px">
    <div style="font:bold 18pt verdana;">
        @ViewBag.Title
    </div>
    <hr style="border:solid 1px #000080; background:#000080" />
    <div>
        @{
            if (ViewBag.Viewer is Array)
            {
                // Display multiple charts
                for (int i = 0; i < ViewBag.Viewer.Length; ++i)
                {
                    @:@Html.Raw(ViewBag.Viewer[i].RenderHTML())
                }
            }
            else
            {
                // Display one chart only
                @:@Html.Raw(ViewBag.Viewer.RenderHTML())
            }
        }
    </div>
</body>
</html>
© 2023 Advanced Software Engineering Limited. All rights reserved.