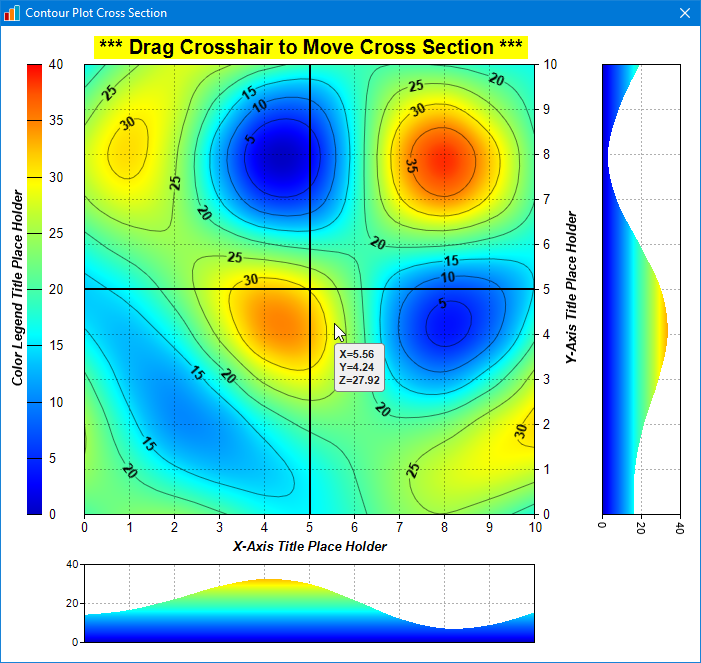
This example demonstrates adding cross sections to a contour chart.
After drawing a contour chart, ContourLayer.getCrossSection can be used to obtain the cross section between two given points on the chart. The cross section is represented as the z values along the straight line joining the two points. In this example, these z values are used to plot area charts to visualize the cross sections.
The main source code listing of this sample program is included at the end of this section. The code consists of the following main parts:
- drawChart: This draws a contour chart, and then calls addCrossSectionX and addCrossSectionY to draw the cross sections.
- addCrossSectionX: This draws the vertical cross section. It obtains the cross section data from ContourLayer.getCrossSection and use it to plot an area chart. The plot area position and size is configured to align to the contour chart, and the x-axis scale and y-axis scale are synchronized with the contour chart using Axis.syncAxis and Axis.syncScale. The area color is based on the contour chart color scale, obtained using ColorAxis.getColorScale, and then applied to the y direction of the XYChart using XYChart.yScaleColor. This makes the area chart color consistent with the contour chart color axis.
- addCrossSectionY: This method is similar to addCrossSectionX except that it draws the horizontal cross section.
- drawCrossHair: This draws the crosshair which represents the cross section lines on the contour chart. It draws on the dynamic layer obtained from BaseChart.initDynamicLayer so that the crosshair can be updated without affecting the underlying contour chart.
- OnMouseMovePlotArea: This includes code to detect if the mouse is dragging on the crosshair, and update the cross section if the crosshair moves.