[Windows Forms - C# version] NetWinCharts\CSharpWinCharts\frmcrosshair.cs
using System;
using System.Collections;
using System.Windows.Forms;
using ChartDirector;
namespace CSharpChartExplorer
{
public partial class FrmCrossHair : Form
{
public FrmCrossHair()
{
InitializeComponent();
}
private void FrmCrossHair_Load(object sender, EventArgs e)
{
// The XY data of the first data series
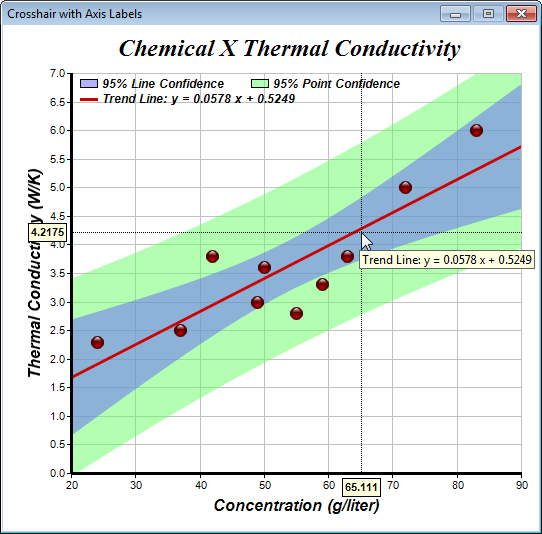
double[] dataX = {50, 55, 37, 24, 42, 49, 63, 72, 83, 59};
double[] dataY = {3.6, 2.8, 2.5, 2.3, 3.8, 3.0, 3.8, 5.0, 6.0, 3.3};
// Create a XYChart object of size 520 x 490 pixels
XYChart c = new XYChart(520, 490);
// Set the plotarea at (60, 40) and of size 450 x 400 pixels, with white background and a light
// grey border (0xc0c0c0). Turn on both horizontal and vertical grid lines with light grey color
// (0xc0c0c0)
c.setPlotArea(60, 40, 450, 400, 0xffffff, -1, 0xc0c0c0, 0xc0c0c0, -1);
// Add a title to the chart using 18 point Times Bold Itatic font.
c.addTitle(" Chemical X Thermal Conductivity", "Times New Roman Bold Italic", 18);
// Add titles to the axes using 12pt Arial Bold Italic font
c.yAxis().setTitle("Thermal Conductivity (W/K)", "Arial Bold Italic", 12);
c.xAxis().setTitle("Concentration (g/liter)", "Arial Bold Italic", 12);
// Set the axes line width to 3 pixels
c.yAxis().setWidth(3);
c.xAxis().setWidth(3);
// Add a scatter layer using (dataX, dataY)
ScatterLayer scatterLayer = c.addScatterLayer(dataX, dataY, "", Chart.GlassSphereShape, 13,
0xcc0000);
// Tooltip for the scatter layer
scatterLayer.setHTMLImageMap("", "",
"title='Concentration: {x} g/liter, Conductivity: {value} W/K'");
// Add a trend line layer for (dataX, dataY)
TrendLayer trendLayer = c.addTrendLayer2(dataX, dataY, 0xcc0000);
// Set the line width to 3 pixels
trendLayer.setLineWidth(3);
// Add a 95% confidence band for the line
trendLayer.addConfidenceBand(0.95, unchecked((int)0x806666ff));
// Add a 95% confidence band (prediction band) for the points
trendLayer.addPredictionBand(0.95, unchecked((int)0x8066ff66));
// Tool tip for the trend layer
trendLayer.setHTMLImageMap("", "", "title='Trend Line: y = {slope|P4} x + {intercept|P4}'");
// Add a legend box at (60, 35) (top of the chart) with horizontal layout. Use 10pt Arial Bold
// Italic font. Set the background and border color to Transparent and use line style legend
// icons.
LegendBox legendBox = c.addLegend(60, 35, false, "Arial Bold Italic", 9);
legendBox.setBackground(Chart.Transparent);
legendBox.setLineStyleKey(true);
// Add entries to the legend box
legendBox.addKey("95% Line Confidence", unchecked((int)0x806666ff));
legendBox.addKey("95% Point Confidence", unchecked((int)0x8066ff66));
legendBox.addKey(String.Format("Trend Line: y = {0:0.0000} x + {1:0.0000}", trendLayer.getSlope(),
trendLayer.getIntercept()), 0xcc0000, 3);
// Assign the chart to the WinChartViewer
winChartViewer1.Chart = c;
// Include tool tip for the chart
winChartViewer1.ImageMap = c.getHTMLImageMap("");
}
//
// Draw track cursor when mouse is moving over plotarea
//
private void winChartViewer1_MouseMovePlotArea(object sender, MouseEventArgs e)
{
WinChartViewer viewer = (WinChartViewer)sender;
crossHair((XYChart)viewer.Chart, viewer.PlotAreaMouseX, viewer.PlotAreaMouseY);
viewer.updateDisplay();
// Hide the track cursor when the mouse leaves the plot area
viewer.removeDynamicLayer("MouseLeavePlotArea");
}
//
// Draw cross hair cursor with axis labels
//
private void crossHair(XYChart c, int mouseX, int mouseY)
{
// Clear the current dynamic layer and get the DrawArea object to draw on it.
DrawArea d = c.initDynamicLayer();
// The plot area object
PlotArea plotArea = c.getPlotArea();
// Draw a vertical line and a horizontal line as the cross hair
d.vline(plotArea.getTopY(), plotArea.getBottomY(), mouseX, d.dashLineColor(0x000000, 0x0101));
d.hline(plotArea.getLeftX(), plotArea.getRightX(), mouseY, d.dashLineColor(0x000000, 0x0101));
// Draw y-axis label
string label = "<*block,bgColor=FFFFDD,margin=3,edgeColor=000000*>" + c.formatValue(c.getYValue(
mouseY, c.yAxis()), "{value|P4}") + "<*/*>";
TTFText t = d.text(label, "Arial Bold", 8);
t.draw(plotArea.getLeftX() - 5, mouseY, 0x000000, Chart.Right);
// Draw x-axis label
label = "<*block,bgColor=FFFFDD,margin=3,edgeColor=000000*>" + c.formatValue(c.getXValue(mouseX),
"{value|P4}") + "<*/*>";
t = d.text(label, "Arial Bold", 8);
t.draw(mouseX, plotArea.getBottomY() + 5, 0x000000, Chart.Top);
}
}
}
[Windows Forms - VB Version] NetWinCharts\VBNetWinCharts\frmcrosshair.vb
Imports ChartDirector
Imports System.Collections

Public Class FrmCrossHair

    Private Sub FrmCrossHair_Load(ByVal sender As Object, ByVal e As System.EventArgs) Handles MyBase.Load

        ' The XY data of the first data series
        Dim dataX() As Double = {50, 55, 37, 24, 42, 49, 63, 72, 83, 59}
        Dim dataY() As Double = {3.6, 2.8, 2.5, 2.3, 3.8, 3.0, 3.8, 5.0, 6.0, 3.3}

        ' Create a XYChart object of size 520 x 490 pixels
        Dim c As XYChart = New XYChart(520, 490)

        ' Set the plotarea at (60, 40) and of size 450 x 400 pixels, with white background and a light grey
        ' border (0xc0c0c0). Turn on both horizontal and vertical grid lines with light grey color (0xc0c0c0)
        c.setPlotArea(60, 40, 450, 400, &Hffffff, -1, &Hc0c0c0, &Hc0c0c0, -1)

        ' Add a title to the chart using 18 point Times Bold Itatic font.
        c.addTitle("      Chemical X Thermal Conductivity", "Times New Roman Bold Italic", 18)

        ' Add titles to the axes using 12pt Arial Bold Italic font
        c.yAxis().setTitle("Thermal Conductivity (W/K)", "Arial Bold Italic", 12)
        c.xAxis().setTitle("Concentration (g/liter)", "Arial Bold Italic", 12)

        ' Set the axes line width to 3 pixels
        c.yAxis().setWidth(3)
        c.xAxis().setWidth(3)

        ' Add a scatter layer using (dataX, dataY)
        Dim scatterLayer As ScatterLayer = c.addScatterLayer(dataX, dataY, "", Chart.GlassSphereShape, 13, _
            &Hcc0000)

        ' Tooltip for the scatter layer
        scatterLayer.setHTMLImageMap("", "", "title='Concentration: {x} g/liter, Conductivity: {value} W/K'")

        ' Add a trend line layer for (dataX, dataY)
        Dim trendLayer As TrendLayer = c.addTrendLayer2(dataX, dataY, &Hcc0000)

        ' Set the line width to 3 pixels
        trendLayer.setLineWidth(3)

        ' Add a 95% confidence band for the line
        trendLayer.addConfidenceBand(0.95, &H806666ff)

        ' Add a 95% confidence band (prediction band) for the points
        trendLayer.addPredictionBand(0.95, &H8066ff66)

        ' Tool tip for the trend layer
        trendLayer.setHTMLImageMap("", "", "title='Trend Line: y = {slope|P4} x + {intercept|P4}'")

        ' Add a legend box at (60, 35) (top of the chart) with horizontal layout. Use 10pt Arial Bold Italic
        ' font. Set the background and border color to Transparent and use line style legend icons.
        Dim legendBox As LegendBox = c.addLegend(60, 35, False, "Arial Bold Italic", 9)
        legendBox.setBackground(Chart.Transparent)
        legendBox.setLineStyleKey(True)

        ' Add entries to the legend box
        legendBox.addKey("95% Line Confidence", &H806666ff)
        legendBox.addKey("95% Point Confidence", &H8066ff66)
        legendBox.addKey("Trend Line: y = " & FormatNumber(trendLayer.getSlope(), 4) & " x + " & _
            FormatNumber(trendLayer.getIntercept(), 4), &Hcc0000, 3)

        ' Assign the chart to the WinChartViewer
        winChartViewer1.Chart = c

        ' Include tool tip for the chart
        winChartViewer1.ImageMap = c.getHTMLImageMap("")

    End Sub

    '
    ' Draw track cursor when mouse is moving over plotarea
    '
    Private Sub winChartViewer1_MouseMovePlotArea(ByVal sender As Object, _
        ByVal e As System.Windows.Forms.MouseEventArgs) Handles winChartViewer1.MouseMovePlotArea

        Dim viewer As WinChartViewer = sender
        crossHair(viewer.Chart, viewer.PlotAreaMouseX, viewer.PlotAreaMouseY)
        viewer.updateDisplay()

        ' Hide the track cursor when the mouse leaves the plot area
        viewer.removeDynamicLayer("MouseLeavePlotArea")

    End Sub

    '
    ' Draw cross hair cursor with axis labels
    '
    Private Sub crossHair(c As XYChart, mouseX As Integer, mouseY As Integer)

        ' Clear the current dynamic layer and get the DrawArea object to draw on it.
        Dim d As DrawArea = c.initDynamicLayer()

        ' The plot area object
        Dim plotArea As PlotArea = c.getPlotArea()

        ' Draw a vertical line and a horizontal line as the cross hair
        d.vline(plotArea.getTopY(), plotArea.getBottomY(), mouseX, d.dashLineColor(&H000000, &H0101))
        d.hline(plotArea.getLeftX(), plotArea.getRightX(), mouseY, d.dashLineColor(&H000000, &H0101))

        ' Draw y-axis label
        Dim label As String = "<*block,bgColor=FFFFDD,margin=3,edgeColor=000000*>" & c.formatValue( _
            c.getYValue(mouseY, c.yAxis()), "{value|P4}") & "<*/*>"
        Dim t As TTFText = d.text(label, "Arial Bold", 8)
        t.draw(plotArea.getLeftX() - 5, mouseY, &H000000, Chart.Right)

        ' Draw x-axis label
        label = "<*block,bgColor=FFFFDD,margin=3,edgeColor=000000*>" & c.formatValue(c.getXValue(mouseX), _
            "{value|P4}") & "<*/*>"
        t = d.text(label, "Arial Bold", 8)
        t.draw(mouseX, plotArea.getBottomY() + 5, &H000000, Chart.Top)

    End Sub

End Class
[WPF - XAML] NetWPFCharts\CSharpWPFCharts\CrossHairWindow.xaml
<Window x:Class="CSharpWPFCharts.CrossHairWindow"
        xmlns="http://schemas.microsoft.com/winfx/2006/xaml/presentation"
        xmlns:x="http://schemas.microsoft.com/winfx/2006/xaml"
        xmlns:d="http://schemas.microsoft.com/expression/blend/2008"
        xmlns:mc="http://schemas.openxmlformats.org/markup-compatibility/2006"
        xmlns:local="clr-namespace:CSharpWPFCharts"
        mc:Ignorable="d"
        xmlns:ChartDirector="clr-namespace:ChartDirector;assembly=netchartdir" UseLayoutRounding="True"
        Title="Crosshair with Axis Labels" SizeToContent="WidthAndHeight" ResizeMode="NoResize" Loaded="Window_Loaded">
    <Grid>
        <ChartDirector:WPFChartViewer x:Name="WPFChartViewer1" Margin="5" MouseMovePlotArea="WPFChartViewer1_MouseMovePlotArea" />
    </Grid>
</Window>
[WPF - C#] NetWPFCharts\CSharpWPFCharts\CrossHairWindow.xaml.cs
using System;
using System.Collections;
using System.Windows;
using System.Windows.Input;
using ChartDirector;

namespace CSharpWPFCharts
{
    public partial class CrossHairWindow : Window
    {
        public CrossHairWindow()
        {
            InitializeComponent();
        }

        private void Window_Loaded(object sender, RoutedEventArgs e)
        {
            // The XY data of the first data series
            double[] dataX = {50, 55, 37, 24, 42, 49, 63, 72, 83, 59};
            double[] dataY = {3.6, 2.8, 2.5, 2.3, 3.8, 3.0, 3.8, 5.0, 6.0, 3.3};

            // Create a XYChart object of size 520 x 490 pixels
            XYChart c = new XYChart(520, 490);

            // Set the plotarea at (60, 40) and of size 450 x 400 pixels, with white background and a light
            // grey border (0xc0c0c0). Turn on both horizontal and vertical grid lines with light grey color
            // (0xc0c0c0)
            c.setPlotArea(60, 40, 450, 400, 0xffffff, -1, 0xc0c0c0, 0xc0c0c0, -1);

            // Add a title to the chart using 18 point Times Bold Itatic font.
            c.addTitle("      Chemical X Thermal Conductivity", "Times New Roman Bold Italic", 18);

            // Add titles to the axes using 12pt Arial Bold Italic font
            c.yAxis().setTitle("Thermal Conductivity (W/K)", "Arial Bold Italic", 12);
            c.xAxis().setTitle("Concentration (g/liter)", "Arial Bold Italic", 12);

            // Set the axes line width to 3 pixels
            c.yAxis().setWidth(3);
            c.xAxis().setWidth(3);

            // Add a scatter layer using (dataX, dataY)
            ScatterLayer scatterLayer = c.addScatterLayer(dataX, dataY, "", Chart.GlassSphereShape, 13,
                0xcc0000);

            // Tooltip for the scatter layer
            scatterLayer.setHTMLImageMap("", "",
                "title='Concentration: {x} g/liter, Conductivity: {value} W/K'");

            // Add a trend line layer for (dataX, dataY)
            TrendLayer trendLayer = c.addTrendLayer2(dataX, dataY, 0xcc0000);

            // Set the line width to 3 pixels
            trendLayer.setLineWidth(3);

            // Add a 95% confidence band for the line
            trendLayer.addConfidenceBand(0.95, unchecked((int)0x806666ff));

            // Add a 95% confidence band (prediction band) for the points
            trendLayer.addPredictionBand(0.95, unchecked((int)0x8066ff66));

            // Tool tip for the trend layer
            trendLayer.setHTMLImageMap("", "", "title='Trend Line: y = {slope|P4} x + {intercept|P4}'");

            // Add a legend box at (60, 35) (top of the chart) with horizontal layout. Use 10pt Arial Bold
            // Italic font. Set the background and border color to Transparent and use line style legend
            // icons.
            LegendBox legendBox = c.addLegend(60, 35, false, "Arial Bold Italic", 9);
            legendBox.setBackground(Chart.Transparent);
            legendBox.setLineStyleKey(true);

            // Add entries to the legend box
            legendBox.addKey("95% Line Confidence", unchecked((int)0x806666ff));
            legendBox.addKey("95% Point Confidence", unchecked((int)0x8066ff66));
            legendBox.addKey(String.Format("Trend Line: y = {0:0.0000} x + {1:0.0000}", trendLayer.getSlope(),
                trendLayer.getIntercept()), 0xcc0000, 3);

            // Assign the chart to the WPFChartViewer
            WPFChartViewer1.Chart = c;

            // Include tool tip for the chart
            WPFChartViewer1.ImageMap = c.getHTMLImageMap("");
        }

        //
        // Draw track cursor when mouse is moving over plotarea
        //
        private void WPFChartViewer1_MouseMovePlotArea(object sender, MouseEventArgs e)
        {
            WPFChartViewer viewer = (WPFChartViewer)sender;
            crossHair((XYChart)viewer.Chart, viewer.PlotAreaMouseX, viewer.PlotAreaMouseY);
            viewer.updateDisplay();

            // Hide the track cursor when the mouse leaves the plot area
            viewer.removeDynamicLayer("MouseLeavePlotArea");
        }

        //
        // Draw cross hair cursor with axis labels
        //
        private void crossHair(XYChart c, int mouseX, int mouseY)
        {
            // Clear the current dynamic layer and get the DrawArea object to draw on it.
            DrawArea d = c.initDynamicLayer();

            // The plot area object
            PlotArea plotArea = c.getPlotArea();

            // Draw a vertical line and a horizontal line as the cross hair
            d.vline(plotArea.getTopY(), plotArea.getBottomY(), mouseX, d.dashLineColor(0x000000, 0x0101));
            d.hline(plotArea.getLeftX(), plotArea.getRightX(), mouseY, d.dashLineColor(0x000000, 0x0101));

            // Draw y-axis label
            string label = "<*block,bgColor=FFFFDD,margin=3,edgeColor=000000*>" + c.formatValue(c.getYValue(
                mouseY, c.yAxis()), "{value|P4}") + "<*/*>";
            TTFText t = d.text(label, "Arial Bold", 8);
            t.draw(plotArea.getLeftX() - 5, mouseY, 0x000000, Chart.Right);

            // Draw x-axis label
            label = "<*block,bgColor=FFFFDD,margin=3,edgeColor=000000*>" + c.formatValue(c.getXValue(mouseX),
                "{value|P4}") + "<*/*>";
            t = d.text(label, "Arial Bold", 8);
            t.draw(mouseX, plotArea.getBottomY() + 5, 0x000000, Chart.Top);
        }
    }
}
© 2023 Advanced Software Engineering Limited. All rights reserved.