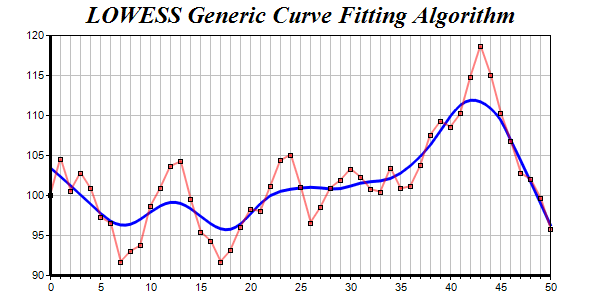
This example demonstrates the LOWESS general purpose curve fitting that is built into ChartDirector.
In regression curve fitting, a function type have to be chosen first, and the data are used to compute the best parameters of that function. For example, in polynomial regression, the function type is a polynomial of a given degree, and the data are used to determine the optimal polynomial coefficients.
However, in many applications, the function type is not known or not expressible in algebraic form. To handle these cases, ChartDirector supports a general curve fitting algorithm known as LOWESS. For details, please refer to
ArrayMath.lowess and
ArrayMath.lowess2.
The LOWESS algorithm only adjusts the points to smoothen them. They still need to be joined together. In this example, the adjusted points are joined with a spline layer using
XYChart.addSplineLayer.
[Windows Forms - C# version] NetWinCharts\CSharpWinCharts\curvefitting.cs
using System;
using ChartDirector;

namespace CSharpChartExplorer
{
    public class curvefitting : DemoModule
    {
        //Name of demo module
        public string getName() { return "General Curve Fitting"; }

        //Number of charts produced in this demo module
        public int getNoOfCharts() { return 1; }

        //Main code for creating chart.
        //Note: the argument chartIndex is unused because this demo only has 1 chart.
        public void createChart(WinChartViewer viewer, int chartIndex)
        {
            // Use random table to generate a random series. The random table is set to 1 col x 51
            // rows, with 9 as the seed
            RanTable rantable = new RanTable(9, 1, 51);

            // Set the 1st column to start from 100, with changes between rows from -5 to +5
            rantable.setCol(0, 100, -5, 5);

            // Get the 1st column of the random table as the data set
            double[] data = rantable.getCol(0);

            // Create a XYChart object of size 600 x 300 pixels
            XYChart c = new XYChart(600, 300);

            // Set the plotarea at (50, 35) and of size 500 x 240 pixels. Enable both the horizontal
            // and vertical grids by setting their colors to grey (0xc0c0c0)
            c.setPlotArea(50, 35, 500, 240).setGridColor(0xc0c0c0, 0xc0c0c0);

            // Add a title to the chart using 18 point Times Bold Itatic font.
            c.addTitle("LOWESS Generic Curve Fitting Algorithm", "Times New Roman Bold Italic", 18);

            // Set the y axis line width to 3 pixels
            c.yAxis().setWidth(3);

            // Add a title to the x axis using 12pt Arial Bold Italic font
            c.xAxis().setTitle("Server Load (TPS)", "Arial Bold Italic", 12);

            // Set the x axis line width to 3 pixels
            c.xAxis().setWidth(3);

            // Set the x axis scale from 0 - 50, with major tick every 5 units and minor tick every
            // 1 unit
            c.xAxis().setLinearScale(0, 50, 5, 1);

            // Add a blue layer to the chart
            LineLayer layer = c.addLineLayer2();

            // Add a red (0x80ff0000) data set to the chart with square symbols
            layer.addDataSet(data, unchecked((int)0x80ff0000)).setDataSymbol(Chart.SquareSymbol);

            // Set the line width to 2 pixels
            layer.setLineWidth(2);

            // Use lowess for curve fitting, and plot the fitted data using a spline layer with line
            // width set to 3 pixels
            c.addSplineLayer(new ArrayMath(data).lowess().result(), 0x0000ff).setLineWidth(3);

            // Set zero affinity to 0 to make sure the line is displayed in the most detail scale
            c.yAxis().setAutoScale(0, 0, 0);

            // Output the chart
            viewer.Chart = c;

            //include tool tip for the chart
            viewer.ImageMap = c.getHTMLImageMap("clickable", "", "title='({x}, {value|2})'");
        }
    }
}
[Windows Forms - VB Version] NetWinCharts\VBNetWinCharts\curvefitting.vb
Imports System
Imports Microsoft.VisualBasic
Imports ChartDirector

Public Class curvefitting
    Implements DemoModule

    'Name of demo module
    Public Function getName() As String Implements DemoModule.getName
        Return "General Curve Fitting"
    End Function

    'Number of charts produced in this demo module
    Public Function getNoOfCharts() As Integer Implements DemoModule.getNoOfCharts
        Return 1
    End Function

    'Main code for creating chart.
    'Note: the argument chartIndex is unused because this demo only has 1 chart.
    Public Sub createChart(viewer As WinChartViewer, chartIndex As Integer) _
        Implements DemoModule.createChart

        ' Use random table to generate a random series. The random table is set to 1 col x 51 rows,
        ' with 9 as the seed
        Dim rantable As RanTable = New RanTable(9, 1, 51)

        ' Set the 1st column to start from 100, with changes between rows from -5 to +5
        rantable.setCol(0, 100, -5, 5)

        ' Get the 1st column of the random table as the data set
        Dim data() As Double = rantable.getCol(0)

        ' Create a XYChart object of size 600 x 300 pixels
        Dim c As XYChart = New XYChart(600, 300)

        ' Set the plotarea at (50, 35) and of size 500 x 240 pixels. Enable both the horizontal and
        ' vertical grids by setting their colors to grey (0xc0c0c0)
        c.setPlotArea(50, 35, 500, 240).setGridColor(&Hc0c0c0, &Hc0c0c0)

        ' Add a title to the chart using 18 point Times Bold Itatic font.
        c.addTitle("LOWESS Generic Curve Fitting Algorithm", "Times New Roman Bold Italic", 18)

        ' Set the y axis line width to 3 pixels
        c.yAxis().setWidth(3)

        ' Add a title to the x axis using 12pt Arial Bold Italic font
        c.xAxis().setTitle("Server Load (TPS)", "Arial Bold Italic", 12)

        ' Set the x axis line width to 3 pixels
        c.xAxis().setWidth(3)

        ' Set the x axis scale from 0 - 50, with major tick every 5 units and minor tick every 1
        ' unit
        c.xAxis().setLinearScale(0, 50, 5, 1)

        ' Add a blue layer to the chart
        Dim layer As LineLayer = c.addLineLayer2()

        ' Add a red (0x80ff0000) data set to the chart with square symbols
        layer.addDataSet(data, &H80ff0000).setDataSymbol(Chart.SquareSymbol)

        ' Set the line width to 2 pixels
        layer.setLineWidth(2)

        ' Use lowess for curve fitting, and plot the fitted data using a spline layer with line
        ' width set to 3 pixels
        c.addSplineLayer(New ArrayMath(data).lowess().result(), &H0000ff).setLineWidth(3)

        ' Set zero affinity to 0 to make sure the line is displayed in the most detail scale
        c.yAxis().setAutoScale(0, 0, 0)

        ' Output the chart
        viewer.Chart = c

        'include tool tip for the chart
        viewer.ImageMap = c.getHTMLImageMap("clickable", "", "title='({x}, {value|2})'")

    End Sub

End Class
[WPF - C#] NetWPFCharts\CSharpWPFCharts\curvefitting.cs
using System;
using ChartDirector;

namespace CSharpWPFCharts
{
    public class curvefitting : DemoModule
    {
        //Name of demo module
        public string getName() { return "General Curve Fitting"; }

        //Number of charts produced in this demo module
        public int getNoOfCharts() { return 1; }

        //Main code for creating chart.
        //Note: the argument chartIndex is unused because this demo only has 1 chart.
        public void createChart(WPFChartViewer viewer, int chartIndex)
        {
            // Use random table to generate a random series. The random table is set to 1 col x 51
            // rows, with 9 as the seed
            RanTable rantable = new RanTable(9, 1, 51);

            // Set the 1st column to start from 100, with changes between rows from -5 to +5
            rantable.setCol(0, 100, -5, 5);

            // Get the 1st column of the random table as the data set
            double[] data = rantable.getCol(0);

            // Create a XYChart object of size 600 x 300 pixels
            XYChart c = new XYChart(600, 300);

            // Set the plotarea at (50, 35) and of size 500 x 240 pixels. Enable both the horizontal
            // and vertical grids by setting their colors to grey (0xc0c0c0)
            c.setPlotArea(50, 35, 500, 240).setGridColor(0xc0c0c0, 0xc0c0c0);

            // Add a title to the chart using 18 point Times Bold Itatic font.
            c.addTitle("LOWESS Generic Curve Fitting Algorithm", "Times New Roman Bold Italic", 18);

            // Set the y axis line width to 3 pixels
            c.yAxis().setWidth(3);

            // Add a title to the x axis using 12pt Arial Bold Italic font
            c.xAxis().setTitle("Server Load (TPS)", "Arial Bold Italic", 12);

            // Set the x axis line width to 3 pixels
            c.xAxis().setWidth(3);

            // Set the x axis scale from 0 - 50, with major tick every 5 units and minor tick every
            // 1 unit
            c.xAxis().setLinearScale(0, 50, 5, 1);

            // Add a blue layer to the chart
            LineLayer layer = c.addLineLayer2();

            // Add a red (0x80ff0000) data set to the chart with square symbols
            layer.addDataSet(data, unchecked((int)0x80ff0000)).setDataSymbol(Chart.SquareSymbol);

            // Set the line width to 2 pixels
            layer.setLineWidth(2);

            // Use lowess for curve fitting, and plot the fitted data using a spline layer with line
            // width set to 3 pixels
            c.addSplineLayer(new ArrayMath(data).lowess().result(), 0x0000ff).setLineWidth(3);

            // Set zero affinity to 0 to make sure the line is displayed in the most detail scale
            c.yAxis().setAutoScale(0, 0, 0);

            // Output the chart
            viewer.Chart = c;

            //include tool tip for the chart
            viewer.ImageMap = c.getHTMLImageMap("clickable", "", "title='({x}, {value|2})'");
        }
    }
}
[ASP.NET Web Forms - C# version] NetWebCharts\CSharpASP\curvefitting.aspx
(Click here on how to convert this code to code-behind style.)<%@ Page Language="C#" Debug="true" %>
<%@ Import Namespace="ChartDirector" %>
<%@ Register TagPrefix="chart" Namespace="ChartDirector" Assembly="netchartdir" %>
<!DOCTYPE html>
<script runat="server">
//
// Page Load event handler
//
protected void Page_Load(object sender, EventArgs e)
{
// Use random table to generate a random series. The random table is set to 1 col x 51 rows,
// with 9 as the seed
RanTable rantable = new RanTable(9, 1, 51);
// Set the 1st column to start from 100, with changes between rows from -5 to +5
rantable.setCol(0, 100, -5, 5);
// Get the 1st column of the random table as the data set
double[] data = rantable.getCol(0);
// Create a XYChart object of size 600 x 300 pixels
XYChart c = new XYChart(600, 300);
// Set the plotarea at (50, 35) and of size 500 x 240 pixels. Enable both the horizontal and
// vertical grids by setting their colors to grey (0xc0c0c0)
c.setPlotArea(50, 35, 500, 240).setGridColor(0xc0c0c0, 0xc0c0c0);
// Add a title to the chart using 18 point Times Bold Itatic font.
c.addTitle("LOWESS Generic Curve Fitting Algorithm", "Times New Roman Bold Italic", 18);
// Set the y axis line width to 3 pixels
c.yAxis().setWidth(3);
// Add a title to the x axis using 12pt Arial Bold Italic font
c.xAxis().setTitle("Server Load (TPS)", "Arial Bold Italic", 12);
// Set the x axis line width to 3 pixels
c.xAxis().setWidth(3);
// Set the x axis scale from 0 - 50, with major tick every 5 units and minor tick every 1 unit
c.xAxis().setLinearScale(0, 50, 5, 1);
// Add a blue layer to the chart
LineLayer layer = c.addLineLayer2();
// Add a red (0x80ff0000) data set to the chart with square symbols
layer.addDataSet(data, unchecked((int)0x80ff0000)).setDataSymbol(Chart.SquareSymbol);
// Set the line width to 2 pixels
layer.setLineWidth(2);
// Use lowess for curve fitting, and plot the fitted data using a spline layer with line width
// set to 3 pixels
c.addSplineLayer(new ArrayMath(data).lowess().result(), 0x0000ff).setLineWidth(3);
// Set zero affinity to 0 to make sure the line is displayed in the most detail scale
c.yAxis().setAutoScale(0, 0, 0);
// Output the chart
WebChartViewer1.Image = c.makeWebImage(Chart.SVG);
// Include tool tip for the chart
WebChartViewer1.ImageMap = c.getHTMLImageMap("", "", "title='({x}, {value|2})'");
}
</script>
<html>
<head>
<script type="text/javascript" src="cdjcv.js"></script>
</head>
<body>
<chart:WebChartViewer id="WebChartViewer1" runat="server" />
</body>
</html>
[ASP.NET Web Forms - VB Version] NetWebCharts\VBNetASP\curvefitting.aspx
(Click here on how to convert this code to code-behind style.)<%@ Page Language="VB" Debug="true" %>
<%@ Import Namespace="ChartDirector" %>
<%@ Register TagPrefix="chart" Namespace="ChartDirector" Assembly="netchartdir" %>
<!DOCTYPE html>
<script runat="server">
'
' Page Load event handler
'
Protected Sub Page_Load(ByVal sender As System.Object, ByVal e As System.EventArgs)
' Use random table to generate a random series. The random table is set to 1 col x 51 rows, with
' 9 as the seed
Dim rantable As RanTable = New RanTable(9, 1, 51)
' Set the 1st column to start from 100, with changes between rows from -5 to +5
rantable.setCol(0, 100, -5, 5)
' Get the 1st column of the random table as the data set
Dim data() As Double = rantable.getCol(0)
' Create a XYChart object of size 600 x 300 pixels
Dim c As XYChart = New XYChart(600, 300)
' Set the plotarea at (50, 35) and of size 500 x 240 pixels. Enable both the horizontal and
' vertical grids by setting their colors to grey (0xc0c0c0)
c.setPlotArea(50, 35, 500, 240).setGridColor(&Hc0c0c0, &Hc0c0c0)
' Add a title to the chart using 18 point Times Bold Itatic font.
c.addTitle("LOWESS Generic Curve Fitting Algorithm", "Times New Roman Bold Italic", 18)
' Set the y axis line width to 3 pixels
c.yAxis().setWidth(3)
' Add a title to the x axis using 12pt Arial Bold Italic font
c.xAxis().setTitle("Server Load (TPS)", "Arial Bold Italic", 12)
' Set the x axis line width to 3 pixels
c.xAxis().setWidth(3)
' Set the x axis scale from 0 - 50, with major tick every 5 units and minor tick every 1 unit
c.xAxis().setLinearScale(0, 50, 5, 1)
' Add a blue layer to the chart
Dim layer As LineLayer = c.addLineLayer2()
' Add a red (0x80ff0000) data set to the chart with square symbols
layer.addDataSet(data, &H80ff0000).setDataSymbol(Chart.SquareSymbol)
' Set the line width to 2 pixels
layer.setLineWidth(2)
' Use lowess for curve fitting, and plot the fitted data using a spline layer with line width
' set to 3 pixels
c.addSplineLayer(New ArrayMath(data).lowess().result(), &H0000ff).setLineWidth(3)
' Set zero affinity to 0 to make sure the line is displayed in the most detail scale
c.yAxis().setAutoScale(0, 0, 0)
' Output the chart
WebChartViewer1.Image = c.makeWebImage(Chart.SVG)
' Include tool tip for the chart
WebChartViewer1.ImageMap = c.getHTMLImageMap("", "", "title='({x}, {value|2})'")
End Sub
</script>
<html>
<head>
<script type="text/javascript" src="cdjcv.js"></script>
</head>
<body>
<chart:WebChartViewer id="WebChartViewer1" runat="server" />
</body>
</html>
[ASP.NET MVC - Controller] NetMvcCharts\Controllers\CurvefittingController.cs
using System;
using System.Web.Mvc;
using ChartDirector;

namespace NetMvcCharts.Controllers
{
    public class CurvefittingController : Controller
    {
        //
        // Default Action
        //
        public ActionResult Index()
        {
            ViewBag.Title = "General Curve Fitting";
            createChart(ViewBag.Viewer = new RazorChartViewer(HttpContext, "chart1"));
            return View("~/Views/Shared/ChartView.cshtml");
        }

        //
        // Create chart
        //
        private void createChart(RazorChartViewer viewer)
        {
            // Use random table to generate a random series. The random table is set to 1 col x 51 rows,
            // with 9 as the seed
            RanTable rantable = new RanTable(9, 1, 51);

            // Set the 1st column to start from 100, with changes between rows from -5 to +5
            rantable.setCol(0, 100, -5, 5);

            // Get the 1st column of the random table as the data set
            double[] data = rantable.getCol(0);

            // Create a XYChart object of size 600 x 300 pixels
            XYChart c = new XYChart(600, 300);

            // Set the plotarea at (50, 35) and of size 500 x 240 pixels. Enable both the horizontal and
            // vertical grids by setting their colors to grey (0xc0c0c0)
            c.setPlotArea(50, 35, 500, 240).setGridColor(0xc0c0c0, 0xc0c0c0);

            // Add a title to the chart using 18 point Times Bold Itatic font.
            c.addTitle("LOWESS Generic Curve Fitting Algorithm", "Times New Roman Bold Italic", 18);

            // Set the y axis line width to 3 pixels
            c.yAxis().setWidth(3);

            // Add a title to the x axis using 12pt Arial Bold Italic font
            c.xAxis().setTitle("Server Load (TPS)", "Arial Bold Italic", 12);

            // Set the x axis line width to 3 pixels
            c.xAxis().setWidth(3);

            // Set the x axis scale from 0 - 50, with major tick every 5 units and minor tick every 1
            // unit
            c.xAxis().setLinearScale(0, 50, 5, 1);

            // Add a blue layer to the chart
            LineLayer layer = c.addLineLayer2();

            // Add a red (0x80ff0000) data set to the chart with square symbols
            layer.addDataSet(data, unchecked((int)0x80ff0000)).setDataSymbol(Chart.SquareSymbol);

            // Set the line width to 2 pixels
            layer.setLineWidth(2);

            // Use lowess for curve fitting, and plot the fitted data using a spline layer with line
            // width set to 3 pixels
            c.addSplineLayer(new ArrayMath(data).lowess().result(), 0x0000ff).setLineWidth(3);

            // Set zero affinity to 0 to make sure the line is displayed in the most detail scale
            c.yAxis().setAutoScale(0, 0, 0);

            // Output the chart
            viewer.Image = c.makeWebImage(Chart.SVG);

            // Include tool tip for the chart
            viewer.ImageMap = c.getHTMLImageMap("", "", "title='({x}, {value|2})'");
        }
    }
}
[ASP.NET MVC - View] NetMvcCharts\Views\Shared\ChartView.cshtml
@{ Layout = null; }

<!DOCTYPE html>

<html>
<head>
    <meta name="viewport" content="width=device-width" />
    <title>@ViewBag.Title</title>
    <style>
        @ViewBag.Style
    </style>
    @Scripts.Render("~/Scripts/cdjcv.js")
</head>
<body style="margin:5px 0px 0px 5px">
    <div style="font:bold 18pt verdana;">
        @ViewBag.Title
    </div>
    <hr style="border:solid 1px #000080; background:#000080" />
    <div>
        @{
            if (ViewBag.Viewer is Array)
            {
                // Display multiple charts
                for (int i = 0; i < ViewBag.Viewer.Length; ++i)
                {
                    @:@Html.Raw(ViewBag.Viewer[i].RenderHTML())
                }
            }
            else
            {
                // Display one chart only
                @:@Html.Raw(ViewBag.Viewer.RenderHTML())
            }
        }
    </div>
</body>
</html>
© 2023 Advanced Software Engineering Limited. All rights reserved.