[Windows Forms - C# version] NetWinCharts\CSharpWinCharts\deptharea.cs
using System;
using ChartDirector;
namespace CSharpChartExplorer
{
public class deptharea : DemoModule
{
//Name of demo module
public string getName() { return "Depth Area Chart"; }
//Number of charts produced in this demo module
public int getNoOfCharts() { return 1; }
//Main code for creating chart.
//Note: the argument chartIndex is unused because this demo only has 1 chart.
public void createChart(WinChartViewer viewer, int chartIndex)
{
// The data for the area chart
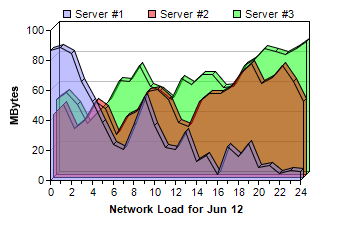
double[] data0 = {42, 49, 33, 38, 51, 46, 29, 41, 44, 57, 59, 52, 37, 34, 51, 56, 56,
60, 70, 76, 63, 67, 75, 64, 51};
double[] data1 = {50, 55, 47, 34, 42, 49, 63, 62, 73, 59, 56, 50, 64, 60, 67, 67, 58,
59, 73, 77, 84, 82, 80, 84, 89};
double[] data2 = {87, 89, 85, 66, 53, 39, 24, 21, 37, 56, 37, 22, 21, 33, 13, 17, 4, 23,
16, 25, 9, 10, 5, 7, 6};
string[] labels = {"0", "1", "2", "3", "4", "5", "6", "7", "8", "9", "10", "11", "12",
"13", "14", "15", "16", "17", "18", "19", "20", "21", "22", "23", "24"};
// Create a XYChart object of size 350 x 230 pixels
XYChart c = new XYChart(350, 230);
// Set the plotarea at (50, 30) and of size 250 x 150 pixels.
c.setPlotArea(50, 30, 250, 150);
// Add a legend box at (55, 0) (top of the chart) using 8pt Arial Font. Set background
// and border to Transparent.
c.addLegend(55, 0, false, "", 8).setBackground(Chart.Transparent);
// Add a title to the x axis
c.xAxis().setTitle("Network Load for Jun 12");
// Add a title to the y axis
c.yAxis().setTitle("MBytes");
// Set the labels on the x axis.
c.xAxis().setLabels(labels);
// Display 1 out of 2 labels on the x-axis. Show minor ticks for remaining labels.
c.xAxis().setLabelStep(2, 1);
// Add three area layers, each representing one data set. The areas are drawn in
// semi-transparent colors.
c.addAreaLayer(data2, unchecked((int)0x808080ff), "Server #1", 3);
c.addAreaLayer(data0, unchecked((int)0x80ff0000), "Server #2", 3);
c.addAreaLayer(data1, unchecked((int)0x8000ff00), "Server #3", 3);
// Output the chart
viewer.Chart = c;
//include tool tip for the chart
viewer.ImageMap = c.getHTMLImageMap("clickable", "",
"title='{dataSetName} load at hour {xLabel}: {value} MBytes'");
}
}
}
[Windows Forms - VB Version] NetWinCharts\VBNetWinCharts\deptharea.vb
Imports System
Imports Microsoft.VisualBasic
Imports ChartDirector

Public Class deptharea
    Implements DemoModule

    'Name of demo module
    Public Function getName() As String Implements DemoModule.getName
        Return "Depth Area Chart"
    End Function

    'Number of charts produced in this demo module
    Public Function getNoOfCharts() As Integer Implements DemoModule.getNoOfCharts
        Return 1
    End Function

    'Main code for creating chart.
    'Note: the argument chartIndex is unused because this demo only has 1 chart.
    Public Sub createChart(viewer As WinChartViewer, chartIndex As Integer) _
        Implements DemoModule.createChart

        ' The data for the area chart
        Dim data0() As Double = {42, 49, 33, 38, 51, 46, 29, 41, 44, 57, 59, 52, 37, 34, 51, 56, _
            56, 60, 70, 76, 63, 67, 75, 64, 51}
        Dim data1() As Double = {50, 55, 47, 34, 42, 49, 63, 62, 73, 59, 56, 50, 64, 60, 67, 67, _
            58, 59, 73, 77, 84, 82, 80, 84, 89}
        Dim data2() As Double = {87, 89, 85, 66, 53, 39, 24, 21, 37, 56, 37, 22, 21, 33, 13, 17, _
            4, 23, 16, 25, 9, 10, 5, 7, 6}
        Dim labels() As String = {"0", "1", "2", "3", "4", "5", "6", "7", "8", "9", "10", "11", _
            "12", "13", "14", "15", "16", "17", "18", "19", "20", "21", "22", "23", "24"}

        ' Create a XYChart object of size 350 x 230 pixels
        Dim c As XYChart = New XYChart(350, 230)

        ' Set the plotarea at (50, 30) and of size 250 x 150 pixels.
        c.setPlotArea(50, 30, 250, 150)

        ' Add a legend box at (55, 0) (top of the chart) using 8pt Arial Font. Set background and
        ' border to Transparent.
        c.addLegend(55, 0, False, "", 8).setBackground(Chart.Transparent)

        ' Add a title to the x axis
        c.xAxis().setTitle("Network Load for Jun 12")

        ' Add a title to the y axis
        c.yAxis().setTitle("MBytes")

        ' Set the labels on the x axis.
        c.xAxis().setLabels(labels)

        ' Display 1 out of 2 labels on the x-axis. Show minor ticks for remaining labels.
        c.xAxis().setLabelStep(2, 1)

        ' Add three area layers, each representing one data set. The areas are drawn in
        ' semi-transparent colors.
        c.addAreaLayer(data2, &H808080ff, "Server #1", 3)
        c.addAreaLayer(data0, &H80ff0000, "Server #2", 3)
        c.addAreaLayer(data1, &H8000ff00, "Server #3", 3)

        ' Output the chart
        viewer.Chart = c

        'include tool tip for the chart
        viewer.ImageMap = c.getHTMLImageMap("clickable", "", _
            "title='{dataSetName} load at hour {xLabel}: {value} MBytes'")

    End Sub

End Class
[WPF - C#] NetWPFCharts\CSharpWPFCharts\deptharea.cs
using System;
using ChartDirector;

namespace CSharpWPFCharts
{
    public class deptharea : DemoModule
    {
        //Name of demo module
        public string getName() { return "Depth Area Chart"; }

        //Number of charts produced in this demo module
        public int getNoOfCharts() { return 1; }

        //Main code for creating chart.
        //Note: the argument chartIndex is unused because this demo only has 1 chart.
        public void createChart(WPFChartViewer viewer, int chartIndex)
        {
            // The data for the area chart
            double[] data0 = {42, 49, 33, 38, 51, 46, 29, 41, 44, 57, 59, 52, 37, 34, 51, 56, 56,
                60, 70, 76, 63, 67, 75, 64, 51};
            double[] data1 = {50, 55, 47, 34, 42, 49, 63, 62, 73, 59, 56, 50, 64, 60, 67, 67, 58,
                59, 73, 77, 84, 82, 80, 84, 89};
            double[] data2 = {87, 89, 85, 66, 53, 39, 24, 21, 37, 56, 37, 22, 21, 33, 13, 17, 4, 23,
                16, 25, 9, 10, 5, 7, 6};
            string[] labels = {"0", "1", "2", "3", "4", "5", "6", "7", "8", "9", "10", "11", "12",
                "13", "14", "15", "16", "17", "18", "19", "20", "21", "22", "23", "24"};

            // Create a XYChart object of size 350 x 230 pixels
            XYChart c = new XYChart(350, 230);

            // Set the plotarea at (50, 30) and of size 250 x 150 pixels.
            c.setPlotArea(50, 30, 250, 150);

            // Add a legend box at (55, 0) (top of the chart) using 8pt Arial Font. Set background
            // and border to Transparent.
            c.addLegend(55, 0, false, "", 8).setBackground(Chart.Transparent);

            // Add a title to the x axis
            c.xAxis().setTitle("Network Load for Jun 12");

            // Add a title to the y axis
            c.yAxis().setTitle("MBytes");

            // Set the labels on the x axis.
            c.xAxis().setLabels(labels);

            // Display 1 out of 2 labels on the x-axis. Show minor ticks for remaining labels.
            c.xAxis().setLabelStep(2, 1);

            // Add three area layers, each representing one data set. The areas are drawn in
            // semi-transparent colors.
            c.addAreaLayer(data2, unchecked((int)0x808080ff), "Server #1", 3);
            c.addAreaLayer(data0, unchecked((int)0x80ff0000), "Server #2", 3);
            c.addAreaLayer(data1, unchecked((int)0x8000ff00), "Server #3", 3);

            // Output the chart
            viewer.Chart = c;

            //include tool tip for the chart
            viewer.ImageMap = c.getHTMLImageMap("clickable", "",
                "title='{dataSetName} load at hour {xLabel}: {value} MBytes'");
        }
    }
}
[ASP.NET Web Forms - C# version] NetWebCharts\CSharpASP\deptharea.aspx
(Click here on how to convert this code to code-behind style.)<%@ Page Language="C#" Debug="true" %>
<%@ Import Namespace="ChartDirector" %>
<%@ Register TagPrefix="chart" Namespace="ChartDirector" Assembly="netchartdir" %>
<!DOCTYPE html>
<script runat="server">
//
// Page Load event handler
//
protected void Page_Load(object sender, EventArgs e)
{
// The data for the area chart
double[] data0 = {42, 49, 33, 38, 51, 46, 29, 41, 44, 57, 59, 52, 37, 34, 51, 56, 56, 60, 70,
76, 63, 67, 75, 64, 51};
double[] data1 = {50, 55, 47, 34, 42, 49, 63, 62, 73, 59, 56, 50, 64, 60, 67, 67, 58, 59, 73,
77, 84, 82, 80, 84, 89};
double[] data2 = {87, 89, 85, 66, 53, 39, 24, 21, 37, 56, 37, 22, 21, 33, 13, 17, 4, 23, 16, 25,
9, 10, 5, 7, 6};
string[] labels = {"0", "1", "2", "3", "4", "5", "6", "7", "8", "9", "10", "11", "12", "13",
"14", "15", "16", "17", "18", "19", "20", "21", "22", "23", "24"};
// Create a XYChart object of size 350 x 230 pixels
XYChart c = new XYChart(350, 230);
// Set the plotarea at (50, 30) and of size 250 x 150 pixels.
c.setPlotArea(50, 30, 250, 150);
// Add a legend box at (55, 0) (top of the chart) using 8pt Arial Font. Set background and
// border to Transparent.
c.addLegend(55, 0, false, "", 8).setBackground(Chart.Transparent);
// Add a title to the x axis
c.xAxis().setTitle("Network Load for Jun 12");
// Add a title to the y axis
c.yAxis().setTitle("MBytes");
// Set the labels on the x axis.
c.xAxis().setLabels(labels);
// Display 1 out of 2 labels on the x-axis. Show minor ticks for remaining labels.
c.xAxis().setLabelStep(2, 1);
// Add three area layers, each representing one data set. The areas are drawn in
// semi-transparent colors.
c.addAreaLayer(data2, unchecked((int)0x808080ff), "Server #1", 3);
c.addAreaLayer(data0, unchecked((int)0x80ff0000), "Server #2", 3);
c.addAreaLayer(data1, unchecked((int)0x8000ff00), "Server #3", 3);
// Output the chart
WebChartViewer1.Image = c.makeWebImage(Chart.SVG);
// Include tool tip for the chart
WebChartViewer1.ImageMap = c.getHTMLImageMap("", "",
"title='{dataSetName} load at hour {xLabel}: {value} MBytes'");
}
</script>
<html>
<head>
<script type="text/javascript" src="cdjcv.js"></script>
</head>
<body>
<chart:WebChartViewer id="WebChartViewer1" runat="server" />
</body>
</html>
[ASP.NET Web Forms - VB Version] NetWebCharts\VBNetASP\deptharea.aspx
(Click here on how to convert this code to code-behind style.)<%@ Page Language="VB" Debug="true" %>
<%@ Import Namespace="ChartDirector" %>
<%@ Register TagPrefix="chart" Namespace="ChartDirector" Assembly="netchartdir" %>
<!DOCTYPE html>
<script runat="server">
'
' Page Load event handler
'
Protected Sub Page_Load(ByVal sender As System.Object, ByVal e As System.EventArgs)
' The data for the area chart
Dim data0() As Double = {42, 49, 33, 38, 51, 46, 29, 41, 44, 57, 59, 52, 37, 34, 51, 56, 56, _
60, 70, 76, 63, 67, 75, 64, 51}
Dim data1() As Double = {50, 55, 47, 34, 42, 49, 63, 62, 73, 59, 56, 50, 64, 60, 67, 67, 58, _
59, 73, 77, 84, 82, 80, 84, 89}
Dim data2() As Double = {87, 89, 85, 66, 53, 39, 24, 21, 37, 56, 37, 22, 21, 33, 13, 17, 4, _
23, 16, 25, 9, 10, 5, 7, 6}
Dim labels() As String = {"0", "1", "2", "3", "4", "5", "6", "7", "8", "9", "10", "11", "12", _
"13", "14", "15", "16", "17", "18", "19", "20", "21", "22", "23", "24"}
' Create a XYChart object of size 350 x 230 pixels
Dim c As XYChart = New XYChart(350, 230)
' Set the plotarea at (50, 30) and of size 250 x 150 pixels.
c.setPlotArea(50, 30, 250, 150)
' Add a legend box at (55, 0) (top of the chart) using 8pt Arial Font. Set background and border
' to Transparent.
c.addLegend(55, 0, False, "", 8).setBackground(Chart.Transparent)
' Add a title to the x axis
c.xAxis().setTitle("Network Load for Jun 12")
' Add a title to the y axis
c.yAxis().setTitle("MBytes")
' Set the labels on the x axis.
c.xAxis().setLabels(labels)
' Display 1 out of 2 labels on the x-axis. Show minor ticks for remaining labels.
c.xAxis().setLabelStep(2, 1)
' Add three area layers, each representing one data set. The areas are drawn in semi-transparent
' colors.
c.addAreaLayer(data2, &H808080ff, "Server #1", 3)
c.addAreaLayer(data0, &H80ff0000, "Server #2", 3)
c.addAreaLayer(data1, &H8000ff00, "Server #3", 3)
' Output the chart
WebChartViewer1.Image = c.makeWebImage(Chart.SVG)
' Include tool tip for the chart
WebChartViewer1.ImageMap = c.getHTMLImageMap("", "", _
"title='{dataSetName} load at hour {xLabel}: {value} MBytes'")
End Sub
</script>
<html>
<head>
<script type="text/javascript" src="cdjcv.js"></script>
</head>
<body>
<chart:WebChartViewer id="WebChartViewer1" runat="server" />
</body>
</html>
[ASP.NET MVC - Controller] NetMvcCharts\Controllers\DepthareaController.cs
using System;
using System.Web.Mvc;
using ChartDirector;

namespace NetMvcCharts.Controllers
{
    public class DepthareaController : Controller
    {
        //
        // Default Action
        //
        public ActionResult Index()
        {
            ViewBag.Title = "Depth Area Chart";
            createChart(ViewBag.Viewer = new RazorChartViewer(HttpContext, "chart1"));
            return View("~/Views/Shared/ChartView.cshtml");
        }

        //
        // Create chart
        //
        private void createChart(RazorChartViewer viewer)
        {
            // The data for the area chart
            double[] data0 = {42, 49, 33, 38, 51, 46, 29, 41, 44, 57, 59, 52, 37, 34, 51, 56, 56, 60, 70,
                76, 63, 67, 75, 64, 51};
            double[] data1 = {50, 55, 47, 34, 42, 49, 63, 62, 73, 59, 56, 50, 64, 60, 67, 67, 58, 59, 73,
                77, 84, 82, 80, 84, 89};
            double[] data2 = {87, 89, 85, 66, 53, 39, 24, 21, 37, 56, 37, 22, 21, 33, 13, 17, 4, 23, 16,
                25, 9, 10, 5, 7, 6};
            string[] labels = {"0", "1", "2", "3", "4", "5", "6", "7", "8", "9", "10", "11", "12", "13",
                "14", "15", "16", "17", "18", "19", "20", "21", "22", "23", "24"};

            // Create a XYChart object of size 350 x 230 pixels
            XYChart c = new XYChart(350, 230);

            // Set the plotarea at (50, 30) and of size 250 x 150 pixels.
            c.setPlotArea(50, 30, 250, 150);

            // Add a legend box at (55, 0) (top of the chart) using 8pt Arial Font. Set background and
            // border to Transparent.
            c.addLegend(55, 0, false, "", 8).setBackground(Chart.Transparent);

            // Add a title to the x axis
            c.xAxis().setTitle("Network Load for Jun 12");

            // Add a title to the y axis
            c.yAxis().setTitle("MBytes");

            // Set the labels on the x axis.
            c.xAxis().setLabels(labels);

            // Display 1 out of 2 labels on the x-axis. Show minor ticks for remaining labels.
            c.xAxis().setLabelStep(2, 1);

            // Add three area layers, each representing one data set. The areas are drawn in
            // semi-transparent colors.
            c.addAreaLayer(data2, unchecked((int)0x808080ff), "Server #1", 3);
            c.addAreaLayer(data0, unchecked((int)0x80ff0000), "Server #2", 3);
            c.addAreaLayer(data1, unchecked((int)0x8000ff00), "Server #3", 3);

            // Output the chart
            viewer.Image = c.makeWebImage(Chart.SVG);

            // Include tool tip for the chart
            viewer.ImageMap = c.getHTMLImageMap("", "",
                "title='{dataSetName} load at hour {xLabel}: {value} MBytes'");
        }
    }
}
[ASP.NET MVC - View] NetMvcCharts\Views\Shared\ChartView.cshtml
@{ Layout = null; }

<!DOCTYPE html>

<html>
<head>
    <meta name="viewport" content="width=device-width" />
    <title>@ViewBag.Title</title>
    <style>
        @ViewBag.Style
    </style>
    @Scripts.Render("~/Scripts/cdjcv.js")
</head>
<body style="margin:5px 0px 0px 5px">
    <div style="font:bold 18pt verdana;">
        @ViewBag.Title
    </div>
    <hr style="border:solid 1px #000080; background:#000080" />
    <div>
        @{
            if (ViewBag.Viewer is Array)
            {
                // Display multiple charts
                for (int i = 0; i < ViewBag.Viewer.Length; ++i)
                {
                    @:@Html.Raw(ViewBag.Viewer[i].RenderHTML())
                }
            }
            else
            {
                // Display one chart only
                @:@Html.Raw(ViewBag.Viewer.RenderHTML())
            }
        }
    </div>
</body>
</html>
© 2023 Advanced Software Engineering Limited. All rights reserved.