[Windows Forms - C# version] NetWinCharts\CSharpWinCharts\discreteheatmap.cs
using System;
using ChartDirector;
namespace CSharpChartExplorer
{
public class discreteheatmap : DemoModule
{
//Name of demo module
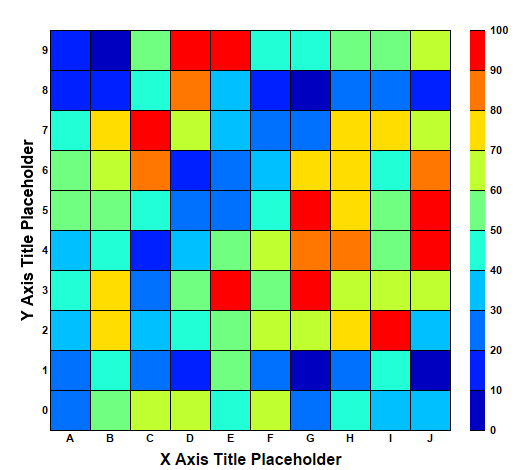
public string getName() { return "Discrete Heat Map"; }
//Number of charts produced in this demo module
public int getNoOfCharts() { return 1; }
//Main code for creating chart.
//Note: the argument chartIndex is unused because this demo only has 1 chart.
public void createChart(WinChartViewer viewer, int chartIndex)
{
// The x-axis and y-axis labels
string[] xLabels = {"A", "B", "C", "D", "E", "F", "G", "H", "I", "J"};
string[] yLabels = {"0", "1", "2", "3", "4", "5", "6", "7", "8", "9"};
// Random data for the 10 x 10 cells
RanSeries r = new RanSeries(2);
double[] zData = r.get2DSeries(xLabels.Length, yLabels.Length, 0, 100);
// Create an XYChart object of size 520 x 470 pixels.
XYChart c = new XYChart(520, 470);
// Set the plotarea at (50, 30) and of size 400 x 400 pixels.
PlotArea p = c.setPlotArea(50, 30, 400, 400);
// Create a discrete heat map with 10 x 10 cells
DiscreteHeatMapLayer layer = c.addDiscreteHeatMapLayer(zData, xLabels.Length);
// Set the x-axis labels. Use 8pt Arial Bold font. Set axis stem to transparent, so only
// the labels are visible. Set 0.5 offset to position the labels in between the grid
// lines.
c.xAxis().setLabels(xLabels);
c.xAxis().setLabelStyle("Arial Bold", 8);
c.xAxis().setColors(Chart.Transparent, Chart.TextColor);
c.xAxis().setLabelOffset(0.5);
c.xAxis().setTitle("X Axis Title Placeholder", "Arial Bold", 12);
// Set the y-axis labels. Use 8pt Arial Bold font. Set axis stem to transparent, so only
// the labels are visible. Set 0.5 offset to position the labels in between the grid
// lines.
c.yAxis().setLabels(yLabels);
c.yAxis().setLabelStyle("Arial Bold", 8);
c.yAxis().setColors(Chart.Transparent, Chart.TextColor);
c.yAxis().setLabelOffset(0.5);
c.yAxis().setTitle("Y Axis Title Placeholder", "Arial Bold", 12);
// Position the color axis 20 pixels to the right of the plot area and of the same
// height as the plot area. Put the labels on the right side of the color axis. Use 8pt
// Arial Bold font for the labels.
ColorAxis cAxis = layer.setColorAxis(p.getRightX() + 20, p.getTopY(), Chart.TopLeft,
p.getHeight(), Chart.Right);
cAxis.setLabelStyle("Arial Bold", 8);
// Output the chart
viewer.Chart = c;
//include tool tip for the chart
viewer.ImageMap = c.getHTMLImageMap("clickable", "",
"title='<*cdml*>({xLabel}, {yLabel}) = {z|2}'");
}
}
}
[Windows Forms - VB Version] NetWinCharts\VBNetWinCharts\discreteheatmap.vb
Imports System
Imports Microsoft.VisualBasic
Imports ChartDirector

Public Class discreteheatmap
    Implements DemoModule

    'Name of demo module
    Public Function getName() As String Implements DemoModule.getName
        Return "Discrete Heat Map"
    End Function

    'Number of charts produced in this demo module
    Public Function getNoOfCharts() As Integer Implements DemoModule.getNoOfCharts
        Return 1
    End Function

    'Main code for creating chart.
    'Note: the argument chartIndex is unused because this demo only has 1 chart.
    Public Sub createChart(viewer As WinChartViewer, chartIndex As Integer) _
        Implements DemoModule.createChart

        ' The x-axis and y-axis labels
        Dim xLabels() As String = {"A", "B", "C", "D", "E", "F", "G", "H", "I", "J"}
        Dim yLabels() As String = {"0", "1", "2", "3", "4", "5", "6", "7", "8", "9"}

        ' Random data for the 10 x 10 cells
        Dim r As RanSeries = New RanSeries(2)
        Dim zData() As Double = r.get2DSeries(UBound(xLabels) + 1, UBound(yLabels) + 1, 0, 100)

        ' Create an XYChart object of size 520 x 470 pixels.
        Dim c As XYChart = New XYChart(520, 470)

        ' Set the plotarea at (50, 30) and of size 400 x 400 pixels.
        Dim p As PlotArea = c.setPlotArea(50, 30, 400, 400)

        ' Create a discrete heat map with 10 x 10 cells
        Dim layer As DiscreteHeatMapLayer = c.addDiscreteHeatMapLayer(zData, UBound(xLabels) + 1)

        ' Set the x-axis labels. Use 8pt Arial Bold font. Set axis stem to transparent, so only the
        ' labels are visible. Set 0.5 offset to position the labels in between the grid lines.
        c.xAxis().setLabels(xLabels)
        c.xAxis().setLabelStyle("Arial Bold", 8)
        c.xAxis().setColors(Chart.Transparent, Chart.TextColor)
        c.xAxis().setLabelOffset(0.5)
        c.xAxis().setTitle("X Axis Title Placeholder", "Arial Bold", 12)

        ' Set the y-axis labels. Use 8pt Arial Bold font. Set axis stem to transparent, so only the
        ' labels are visible. Set 0.5 offset to position the labels in between the grid lines.
        c.yAxis().setLabels(yLabels)
        c.yAxis().setLabelStyle("Arial Bold", 8)
        c.yAxis().setColors(Chart.Transparent, Chart.TextColor)
        c.yAxis().setLabelOffset(0.5)
        c.yAxis().setTitle("Y Axis Title Placeholder", "Arial Bold", 12)

        ' Position the color axis 20 pixels to the right of the plot area and of the same height as
        ' the plot area. Put the labels on the right side of the color axis. Use 8pt Arial Bold font
        ' for the labels.
        Dim cAxis As ColorAxis = layer.setColorAxis(p.getRightX() + 20, p.getTopY(), _
            Chart.TopLeft, p.getHeight(), Chart.Right)
        cAxis.setLabelStyle("Arial Bold", 8)

        ' Output the chart
        viewer.Chart = c

        'include tool tip for the chart
        viewer.ImageMap = c.getHTMLImageMap("clickable", "", _
            "title='<*cdml*>({xLabel}, {yLabel}) = {z|2}'")

    End Sub

End Class
[WPF - C#] NetWPFCharts\CSharpWPFCharts\discreteheatmap.cs
using System;
using ChartDirector;

namespace CSharpWPFCharts
{
    public class discreteheatmap : DemoModule
    {
        //Name of demo module
        public string getName() { return "Discrete Heat Map"; }

        //Number of charts produced in this demo module
        public int getNoOfCharts() { return 1; }

        //Main code for creating chart.
        //Note: the argument chartIndex is unused because this demo only has 1 chart.
        public void createChart(WPFChartViewer viewer, int chartIndex)
        {
            // The x-axis and y-axis labels
            string[] xLabels = {"A", "B", "C", "D", "E", "F", "G", "H", "I", "J"};
            string[] yLabels = {"0", "1", "2", "3", "4", "5", "6", "7", "8", "9"};

            // Random data for the 10 x 10 cells
            RanSeries r = new RanSeries(2);
            double[] zData = r.get2DSeries(xLabels.Length, yLabels.Length, 0, 100);

            // Create an XYChart object of size 520 x 470 pixels.
            XYChart c = new XYChart(520, 470);

            // Set the plotarea at (50, 30) and of size 400 x 400 pixels.
            PlotArea p = c.setPlotArea(50, 30, 400, 400);

            // Create a discrete heat map with 10 x 10 cells
            DiscreteHeatMapLayer layer = c.addDiscreteHeatMapLayer(zData, xLabels.Length);

            // Set the x-axis labels. Use 8pt Arial Bold font. Set axis stem to transparent, so only
            // the labels are visible. Set 0.5 offset to position the labels in between the grid
            // lines.
            c.xAxis().setLabels(xLabels);
            c.xAxis().setLabelStyle("Arial Bold", 8);
            c.xAxis().setColors(Chart.Transparent, Chart.TextColor);
            c.xAxis().setLabelOffset(0.5);
            c.xAxis().setTitle("X Axis Title Placeholder", "Arial Bold", 12);

            // Set the y-axis labels. Use 8pt Arial Bold font. Set axis stem to transparent, so only
            // the labels are visible. Set 0.5 offset to position the labels in between the grid
            // lines.
            c.yAxis().setLabels(yLabels);
            c.yAxis().setLabelStyle("Arial Bold", 8);
            c.yAxis().setColors(Chart.Transparent, Chart.TextColor);
            c.yAxis().setLabelOffset(0.5);
            c.yAxis().setTitle("Y Axis Title Placeholder", "Arial Bold", 12);

            // Position the color axis 20 pixels to the right of the plot area and of the same
            // height as the plot area. Put the labels on the right side of the color axis. Use 8pt
            // Arial Bold font for the labels.
            ColorAxis cAxis = layer.setColorAxis(p.getRightX() + 20, p.getTopY(), Chart.TopLeft,
                p.getHeight(), Chart.Right);
            cAxis.setLabelStyle("Arial Bold", 8);

            // Output the chart
            viewer.Chart = c;

            //include tool tip for the chart
            viewer.ImageMap = c.getHTMLImageMap("clickable", "",
                "title='<*cdml*>({xLabel}, {yLabel}) = {z|2}'");
        }
    }
}
[ASP.NET Web Forms - C# version] NetWebCharts\CSharpASP\discreteheatmap.aspx
(Click here on how to convert this code to code-behind style.)<%@ Page Language="C#" Debug="true" %>
<%@ Import Namespace="ChartDirector" %>
<%@ Register TagPrefix="chart" Namespace="ChartDirector" Assembly="netchartdir" %>
<!DOCTYPE html>
<script runat="server">
//
// Page Load event handler
//
protected void Page_Load(object sender, EventArgs e)
{
// The x-axis and y-axis labels
string[] xLabels = {"A", "B", "C", "D", "E", "F", "G", "H", "I", "J"};
string[] yLabels = {"0", "1", "2", "3", "4", "5", "6", "7", "8", "9"};
// Random data for the 10 x 10 cells
RanSeries r = new RanSeries(2);
double[] zData = r.get2DSeries(xLabels.Length, yLabels.Length, 0, 100);
// Create an XYChart object of size 520 x 470 pixels.
XYChart c = new XYChart(520, 470);
// Set the plotarea at (50, 30) and of size 400 x 400 pixels.
PlotArea p = c.setPlotArea(50, 30, 400, 400);
// Create a discrete heat map with 10 x 10 cells
DiscreteHeatMapLayer layer = c.addDiscreteHeatMapLayer(zData, xLabels.Length);
// Set the x-axis labels. Use 8pt Arial Bold font. Set axis stem to transparent, so only the
// labels are visible. Set 0.5 offset to position the labels in between the grid lines.
c.xAxis().setLabels(xLabels);
c.xAxis().setLabelStyle("Arial Bold", 8);
c.xAxis().setColors(Chart.Transparent, Chart.TextColor);
c.xAxis().setLabelOffset(0.5);
c.xAxis().setTitle("X Axis Title Placeholder", "Arial Bold", 12);
// Set the y-axis labels. Use 8pt Arial Bold font. Set axis stem to transparent, so only the
// labels are visible. Set 0.5 offset to position the labels in between the grid lines.
c.yAxis().setLabels(yLabels);
c.yAxis().setLabelStyle("Arial Bold", 8);
c.yAxis().setColors(Chart.Transparent, Chart.TextColor);
c.yAxis().setLabelOffset(0.5);
c.yAxis().setTitle("Y Axis Title Placeholder", "Arial Bold", 12);
// Position the color axis 20 pixels to the right of the plot area and of the same height as the
// plot area. Put the labels on the right side of the color axis. Use 8pt Arial Bold font for
// the labels.
ColorAxis cAxis = layer.setColorAxis(p.getRightX() + 20, p.getTopY(), Chart.TopLeft,
p.getHeight(), Chart.Right);
cAxis.setLabelStyle("Arial Bold", 8);
// Output the chart
WebChartViewer1.Image = c.makeWebImage(Chart.SVG);
// Include tool tip for the chart
WebChartViewer1.ImageMap = c.getHTMLImageMap("", "",
"title='<*cdml*>({xLabel}, {yLabel}) = {z|2}'");
}
</script>
<html>
<head>
<script type="text/javascript" src="cdjcv.js"></script>
</head>
<body>
<chart:WebChartViewer id="WebChartViewer1" runat="server" />
</body>
</html>
[ASP.NET Web Forms - VB Version] NetWebCharts\VBNetASP\discreteheatmap.aspx
(Click here on how to convert this code to code-behind style.)<%@ Page Language="VB" Debug="true" %>
<%@ Import Namespace="ChartDirector" %>
<%@ Register TagPrefix="chart" Namespace="ChartDirector" Assembly="netchartdir" %>
<!DOCTYPE html>
<script runat="server">
'
' Page Load event handler
'
Protected Sub Page_Load(ByVal sender As System.Object, ByVal e As System.EventArgs)
' The x-axis and y-axis labels
Dim xLabels() As String = {"A", "B", "C", "D", "E", "F", "G", "H", "I", "J"}
Dim yLabels() As String = {"0", "1", "2", "3", "4", "5", "6", "7", "8", "9"}
' Random data for the 10 x 10 cells
Dim r As RanSeries = New RanSeries(2)
Dim zData() As Double = r.get2DSeries(UBound(xLabels) + 1, UBound(yLabels) + 1, 0, 100)
' Create an XYChart object of size 520 x 470 pixels.
Dim c As XYChart = New XYChart(520, 470)
' Set the plotarea at (50, 30) and of size 400 x 400 pixels.
Dim p As PlotArea = c.setPlotArea(50, 30, 400, 400)
' Create a discrete heat map with 10 x 10 cells
Dim layer As DiscreteHeatMapLayer = c.addDiscreteHeatMapLayer(zData, UBound(xLabels) + 1)
' Set the x-axis labels. Use 8pt Arial Bold font. Set axis stem to transparent, so only the
' labels are visible. Set 0.5 offset to position the labels in between the grid lines.
c.xAxis().setLabels(xLabels)
c.xAxis().setLabelStyle("Arial Bold", 8)
c.xAxis().setColors(Chart.Transparent, Chart.TextColor)
c.xAxis().setLabelOffset(0.5)
c.xAxis().setTitle("X Axis Title Placeholder", "Arial Bold", 12)
' Set the y-axis labels. Use 8pt Arial Bold font. Set axis stem to transparent, so only the
' labels are visible. Set 0.5 offset to position the labels in between the grid lines.
c.yAxis().setLabels(yLabels)
c.yAxis().setLabelStyle("Arial Bold", 8)
c.yAxis().setColors(Chart.Transparent, Chart.TextColor)
c.yAxis().setLabelOffset(0.5)
c.yAxis().setTitle("Y Axis Title Placeholder", "Arial Bold", 12)
' Position the color axis 20 pixels to the right of the plot area and of the same height as the
' plot area. Put the labels on the right side of the color axis. Use 8pt Arial Bold font for the
' labels.
Dim cAxis As ColorAxis = layer.setColorAxis(p.getRightX() + 20, p.getTopY(), Chart.TopLeft, _
p.getHeight(), Chart.Right)
cAxis.setLabelStyle("Arial Bold", 8)
' Output the chart
WebChartViewer1.Image = c.makeWebImage(Chart.SVG)
' Include tool tip for the chart
WebChartViewer1.ImageMap = c.getHTMLImageMap("", "", _
"title='<*cdml*>({xLabel}, {yLabel}) = {z|2}'")
End Sub
</script>
<html>
<head>
<script type="text/javascript" src="cdjcv.js"></script>
</head>
<body>
<chart:WebChartViewer id="WebChartViewer1" runat="server" />
</body>
</html>
[ASP.NET MVC - Controller] NetMvcCharts\Controllers\DiscreteheatmapController.cs
using System;
using System.Web.Mvc;
using ChartDirector;

namespace NetMvcCharts.Controllers
{
    public class DiscreteheatmapController : Controller
    {
        //
        // Default Action
        //
        public ActionResult Index()
        {
            ViewBag.Title = "Discrete Heat Map";
            createChart(ViewBag.Viewer = new RazorChartViewer(HttpContext, "chart1"));
            return View("~/Views/Shared/ChartView.cshtml");
        }

        //
        // Create chart
        //
        private void createChart(RazorChartViewer viewer)
        {
            // The x-axis and y-axis labels
            string[] xLabels = {"A", "B", "C", "D", "E", "F", "G", "H", "I", "J"};
            string[] yLabels = {"0", "1", "2", "3", "4", "5", "6", "7", "8", "9"};

            // Random data for the 10 x 10 cells
            RanSeries r = new RanSeries(2);
            double[] zData = r.get2DSeries(xLabels.Length, yLabels.Length, 0, 100);

            // Create an XYChart object of size 520 x 470 pixels.
            XYChart c = new XYChart(520, 470);

            // Set the plotarea at (50, 30) and of size 400 x 400 pixels.
            PlotArea p = c.setPlotArea(50, 30, 400, 400);

            // Create a discrete heat map with 10 x 10 cells
            DiscreteHeatMapLayer layer = c.addDiscreteHeatMapLayer(zData, xLabels.Length);

            // Set the x-axis labels. Use 8pt Arial Bold font. Set axis stem to transparent, so only the
            // labels are visible. Set 0.5 offset to position the labels in between the grid lines.
            c.xAxis().setLabels(xLabels);
            c.xAxis().setLabelStyle("Arial Bold", 8);
            c.xAxis().setColors(Chart.Transparent, Chart.TextColor);
            c.xAxis().setLabelOffset(0.5);
            c.xAxis().setTitle("X Axis Title Placeholder", "Arial Bold", 12);

            // Set the y-axis labels. Use 8pt Arial Bold font. Set axis stem to transparent, so only the
            // labels are visible. Set 0.5 offset to position the labels in between the grid lines.
            c.yAxis().setLabels(yLabels);
            c.yAxis().setLabelStyle("Arial Bold", 8);
            c.yAxis().setColors(Chart.Transparent, Chart.TextColor);
            c.yAxis().setLabelOffset(0.5);
            c.yAxis().setTitle("Y Axis Title Placeholder", "Arial Bold", 12);

            // Position the color axis 20 pixels to the right of the plot area and of the same height as
            // the plot area. Put the labels on the right side of the color axis. Use 8pt Arial Bold font
            // for the labels.
            ColorAxis cAxis = layer.setColorAxis(p.getRightX() + 20, p.getTopY(), Chart.TopLeft,
                p.getHeight(), Chart.Right);
            cAxis.setLabelStyle("Arial Bold", 8);

            // Output the chart
            viewer.Image = c.makeWebImage(Chart.SVG);

            // Include tool tip for the chart
            viewer.ImageMap = c.getHTMLImageMap("", "",
                "title='<*cdml*>({xLabel}, {yLabel}) = {z|2}'");
        }
    }
}
[ASP.NET MVC - View] NetMvcCharts\Views\Shared\ChartView.cshtml
@{ Layout = null; }

<!DOCTYPE html>

<html>
<head>
    <meta name="viewport" content="width=device-width" />
    <title>@ViewBag.Title</title>
    <style>
        @ViewBag.Style
    </style>
    @Scripts.Render("~/Scripts/cdjcv.js")
</head>
<body style="margin:5px 0px 0px 5px">
    <div style="font:bold 18pt verdana;">
        @ViewBag.Title
    </div>
    <hr style="border:solid 1px #000080; background:#000080" />
    <div>
        @{
            if (ViewBag.Viewer is Array)
            {
                // Display multiple charts
                for (int i = 0; i < ViewBag.Viewer.Length; ++i)
                {
                    @:@Html.Raw(ViewBag.Viewer[i].RenderHTML())
                }
            }
            else
            {
                // Display one chart only
                @:@Html.Raw(ViewBag.Viewer.RenderHTML())
            }
        }
    </div>
</body>
</html>
© 2023 Advanced Software Engineering Limited. All rights reserved.