[Windows Forms - C# version] NetWinCharts\CSharpWinCharts\floatingbox.cs
using System;
using ChartDirector;
namespace CSharpChartExplorer
{
public class floatingbox : DemoModule
{
//Name of demo module
public string getName() { return "Floating Box Chart"; }
//Number of charts produced in this demo module
public int getNoOfCharts() { return 1; }
//Main code for creating chart.
//Note: the argument chartIndex is unused because this demo only has 1 chart.
public void createChart(WinChartViewer viewer, int chartIndex)
{
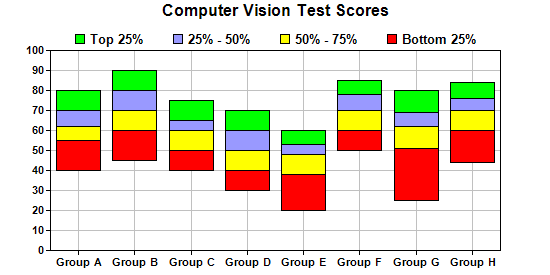
// Sample data for the Box-Whisker chart. Represents the minimum, 1st quartile, medium,
// 3rd quartile and maximum values of some quantities
double[] Q0Data = {40, 45, 40, 30, 20, 50, 25, 44};
double[] Q1Data = {55, 60, 50, 40, 38, 60, 51, 60};
double[] Q2Data = {62, 70, 60, 50, 48, 70, 62, 70};
double[] Q3Data = {70, 80, 65, 60, 53, 78, 69, 76};
double[] Q4Data = {80, 90, 75, 70, 60, 85, 80, 84};
// The labels for the chart
string[] labels = {"Group A", "Group B", "Group C", "Group D", "Group E", "Group F",
"Group G", "Group H"};
// Create a XYChart object of size 550 x 250 pixels
XYChart c = new XYChart(550, 275);
// Set the plotarea at (50, 25) and of size 450 x 200 pixels. Enable both horizontal and
// vertical grids by setting their colors to grey (0xc0c0c0)
c.setPlotArea(50, 50, 450, 200).setGridColor(0xc0c0c0, 0xc0c0c0);
// Add a title to the chart
c.addTitle("Computer Vision Test Scores");
// Set the labels on the x axis and the font to Arial Bold
c.xAxis().setLabels(labels).setFontStyle("Arial Bold");
// Set the font for the y axis labels to Arial Bold
c.yAxis().setLabelStyle("Arial Bold");
// Add a Box Whisker layer using light blue 0x9999ff as the fill color and blue (0xcc)
// as the line color. Set the line width to 2 pixels
c.addBoxLayer(Q4Data, Q3Data, 0x00ff00, "Top 25%");
c.addBoxLayer(Q3Data, Q2Data, 0x9999ff, "25% - 50%");
c.addBoxLayer(Q2Data, Q1Data, 0xffff00, "50% - 75%");
c.addBoxLayer(Q1Data, Q0Data, 0xff0000, "Bottom 25%");
// Add legend box at top center above the plot area using 10pt Arial Bold Font
LegendBox b = c.addLegend(50 + 225, 22, false, "Arial Bold", 10);
b.setAlignment(Chart.TopCenter);
b.setBackground(Chart.Transparent);
// Output the chart
viewer.Chart = c;
//include tool tip for the chart
viewer.ImageMap = c.getHTMLImageMap("clickable", "",
"title='{xLabel} ({dataSetName}): {bottom} to {top} points'");
}
}
}
[Windows Forms - VB Version] NetWinCharts\VBNetWinCharts\floatingbox.vb
Imports System
Imports Microsoft.VisualBasic
Imports ChartDirector

Public Class floatingbox
    Implements DemoModule

    'Name of demo module
    Public Function getName() As String Implements DemoModule.getName
        Return "Floating Box Chart"
    End Function

    'Number of charts produced in this demo module
    Public Function getNoOfCharts() As Integer Implements DemoModule.getNoOfCharts
        Return 1
    End Function

    'Main code for creating chart.
    'Note: the argument chartIndex is unused because this demo only has 1 chart.
    Public Sub createChart(viewer As WinChartViewer, chartIndex As Integer) _
        Implements DemoModule.createChart

        ' Sample data for the Box-Whisker chart. Represents the minimum, 1st quartile, medium, 3rd
        ' quartile and maximum values of some quantities
        Dim Q0Data() As Double = {40, 45, 40, 30, 20, 50, 25, 44}
        Dim Q1Data() As Double = {55, 60, 50, 40, 38, 60, 51, 60}
        Dim Q2Data() As Double = {62, 70, 60, 50, 48, 70, 62, 70}
        Dim Q3Data() As Double = {70, 80, 65, 60, 53, 78, 69, 76}
        Dim Q4Data() As Double = {80, 90, 75, 70, 60, 85, 80, 84}

        ' The labels for the chart
        Dim labels() As String = {"Group A", "Group B", "Group C", "Group D", "Group E", _
            "Group F", "Group G", "Group H"}

        ' Create a XYChart object of size 550 x 250 pixels
        Dim c As XYChart = New XYChart(550, 275)

        ' Set the plotarea at (50, 25) and of size 450 x 200 pixels. Enable both horizontal and
        ' vertical grids by setting their colors to grey (0xc0c0c0)
        c.setPlotArea(50, 50, 450, 200).setGridColor(&Hc0c0c0, &Hc0c0c0)

        ' Add a title to the chart
        c.addTitle("Computer Vision Test Scores")

        ' Set the labels on the x axis and the font to Arial Bold
        c.xAxis().setLabels(labels).setFontStyle("Arial Bold")

        ' Set the font for the y axis labels to Arial Bold
        c.yAxis().setLabelStyle("Arial Bold")

        ' Add a Box Whisker layer using light blue 0x9999ff as the fill color and blue (0xcc) as the
        ' line color. Set the line width to 2 pixels
        c.addBoxLayer(Q4Data, Q3Data, &H00ff00, "Top 25%")
        c.addBoxLayer(Q3Data, Q2Data, &H9999ff, "25% - 50%")
        c.addBoxLayer(Q2Data, Q1Data, &Hffff00, "50% - 75%")
        c.addBoxLayer(Q1Data, Q0Data, &Hff0000, "Bottom 25%")

        ' Add legend box at top center above the plot area using 10pt Arial Bold Font
        Dim b As LegendBox = c.addLegend(50 + 225, 22, False, "Arial Bold", 10)
        b.setAlignment(Chart.TopCenter)
        b.setBackground(Chart.Transparent)

        ' Output the chart
        viewer.Chart = c

        'include tool tip for the chart
        viewer.ImageMap = c.getHTMLImageMap("clickable", "", _
            "title='{xLabel} ({dataSetName}): {bottom} to {top} points'")

    End Sub

End Class
[WPF - C#] NetWPFCharts\CSharpWPFCharts\floatingbox.cs
using System;
using ChartDirector;

namespace CSharpWPFCharts
{
    public class floatingbox : DemoModule
    {
        //Name of demo module
        public string getName() { return "Floating Box Chart"; }

        //Number of charts produced in this demo module
        public int getNoOfCharts() { return 1; }

        //Main code for creating chart.
        //Note: the argument chartIndex is unused because this demo only has 1 chart.
        public void createChart(WPFChartViewer viewer, int chartIndex)
        {
            // Sample data for the Box-Whisker chart. Represents the minimum, 1st quartile, medium,
            // 3rd quartile and maximum values of some quantities
            double[] Q0Data = {40, 45, 40, 30, 20, 50, 25, 44};
            double[] Q1Data = {55, 60, 50, 40, 38, 60, 51, 60};
            double[] Q2Data = {62, 70, 60, 50, 48, 70, 62, 70};
            double[] Q3Data = {70, 80, 65, 60, 53, 78, 69, 76};
            double[] Q4Data = {80, 90, 75, 70, 60, 85, 80, 84};

            // The labels for the chart
            string[] labels = {"Group A", "Group B", "Group C", "Group D", "Group E", "Group F",
                "Group G", "Group H"};

            // Create a XYChart object of size 550 x 250 pixels
            XYChart c = new XYChart(550, 275);

            // Set the plotarea at (50, 25) and of size 450 x 200 pixels. Enable both horizontal and
            // vertical grids by setting their colors to grey (0xc0c0c0)
            c.setPlotArea(50, 50, 450, 200).setGridColor(0xc0c0c0, 0xc0c0c0);

            // Add a title to the chart
            c.addTitle("Computer Vision Test Scores");

            // Set the labels on the x axis and the font to Arial Bold
            c.xAxis().setLabels(labels).setFontStyle("Arial Bold");

            // Set the font for the y axis labels to Arial Bold
            c.yAxis().setLabelStyle("Arial Bold");

            // Add a Box Whisker layer using light blue 0x9999ff as the fill color and blue (0xcc)
            // as the line color. Set the line width to 2 pixels
            c.addBoxLayer(Q4Data, Q3Data, 0x00ff00, "Top 25%");
            c.addBoxLayer(Q3Data, Q2Data, 0x9999ff, "25% - 50%");
            c.addBoxLayer(Q2Data, Q1Data, 0xffff00, "50% - 75%");
            c.addBoxLayer(Q1Data, Q0Data, 0xff0000, "Bottom 25%");

            // Add legend box at top center above the plot area using 10pt Arial Bold Font
            LegendBox b = c.addLegend(50 + 225, 22, false, "Arial Bold", 10);
            b.setAlignment(Chart.TopCenter);
            b.setBackground(Chart.Transparent);

            // Output the chart
            viewer.Chart = c;

            //include tool tip for the chart
            viewer.ImageMap = c.getHTMLImageMap("clickable", "",
                "title='{xLabel} ({dataSetName}): {bottom} to {top} points'");
        }
    }
}
[ASP.NET Web Forms - C# version] NetWebCharts\CSharpASP\floatingbox.aspx
(Click here on how to convert this code to code-behind style.)<%@ Page Language="C#" Debug="true" %>
<%@ Import Namespace="ChartDirector" %>
<%@ Register TagPrefix="chart" Namespace="ChartDirector" Assembly="netchartdir" %>
<!DOCTYPE html>
<script runat="server">
//
// Page Load event handler
//
protected void Page_Load(object sender, EventArgs e)
{
// Sample data for the Box-Whisker chart. Represents the minimum, 1st quartile, medium, 3rd
// quartile and maximum values of some quantities
double[] Q0Data = {40, 45, 40, 30, 20, 50, 25, 44};
double[] Q1Data = {55, 60, 50, 40, 38, 60, 51, 60};
double[] Q2Data = {62, 70, 60, 50, 48, 70, 62, 70};
double[] Q3Data = {70, 80, 65, 60, 53, 78, 69, 76};
double[] Q4Data = {80, 90, 75, 70, 60, 85, 80, 84};
// The labels for the chart
string[] labels = {"Group A", "Group B", "Group C", "Group D", "Group E", "Group F", "Group G",
"Group H"};
// Create a XYChart object of size 550 x 250 pixels
XYChart c = new XYChart(550, 275);
// Set the plotarea at (50, 25) and of size 450 x 200 pixels. Enable both horizontal and
// vertical grids by setting their colors to grey (0xc0c0c0)
c.setPlotArea(50, 50, 450, 200).setGridColor(0xc0c0c0, 0xc0c0c0);
// Add a title to the chart
c.addTitle("Computer Vision Test Scores");
// Set the labels on the x axis and the font to Arial Bold
c.xAxis().setLabels(labels).setFontStyle("Arial Bold");
// Set the font for the y axis labels to Arial Bold
c.yAxis().setLabelStyle("Arial Bold");
// Add a Box Whisker layer using light blue 0x9999ff as the fill color and blue (0xcc) as the
// line color. Set the line width to 2 pixels
c.addBoxLayer(Q4Data, Q3Data, 0x00ff00, "Top 25%");
c.addBoxLayer(Q3Data, Q2Data, 0x9999ff, "25% - 50%");
c.addBoxLayer(Q2Data, Q1Data, 0xffff00, "50% - 75%");
c.addBoxLayer(Q1Data, Q0Data, 0xff0000, "Bottom 25%");
// Add legend box at top center above the plot area using 10pt Arial Bold Font
LegendBox b = c.addLegend(50 + 225, 22, false, "Arial Bold", 10);
b.setAlignment(Chart.TopCenter);
b.setBackground(Chart.Transparent);
// Output the chart
WebChartViewer1.Image = c.makeWebImage(Chart.SVG);
// Include tool tip for the chart
WebChartViewer1.ImageMap = c.getHTMLImageMap("", "",
"title='{xLabel} ({dataSetName}): {bottom} to {top} points'");
}
</script>
<html>
<head>
<script type="text/javascript" src="cdjcv.js"></script>
</head>
<body>
<chart:WebChartViewer id="WebChartViewer1" runat="server" />
</body>
</html>
[ASP.NET Web Forms - VB Version] NetWebCharts\VBNetASP\floatingbox.aspx
(Click here on how to convert this code to code-behind style.)<%@ Page Language="VB" Debug="true" %>
<%@ Import Namespace="ChartDirector" %>
<%@ Register TagPrefix="chart" Namespace="ChartDirector" Assembly="netchartdir" %>
<!DOCTYPE html>
<script runat="server">
'
' Page Load event handler
'
Protected Sub Page_Load(ByVal sender As System.Object, ByVal e As System.EventArgs)
' Sample data for the Box-Whisker chart. Represents the minimum, 1st quartile, medium, 3rd
' quartile and maximum values of some quantities
Dim Q0Data() As Double = {40, 45, 40, 30, 20, 50, 25, 44}
Dim Q1Data() As Double = {55, 60, 50, 40, 38, 60, 51, 60}
Dim Q2Data() As Double = {62, 70, 60, 50, 48, 70, 62, 70}
Dim Q3Data() As Double = {70, 80, 65, 60, 53, 78, 69, 76}
Dim Q4Data() As Double = {80, 90, 75, 70, 60, 85, 80, 84}
' The labels for the chart
Dim labels() As String = {"Group A", "Group B", "Group C", "Group D", "Group E", "Group F", _
"Group G", "Group H"}
' Create a XYChart object of size 550 x 250 pixels
Dim c As XYChart = New XYChart(550, 275)
' Set the plotarea at (50, 25) and of size 450 x 200 pixels. Enable both horizontal and vertical
' grids by setting their colors to grey (0xc0c0c0)
c.setPlotArea(50, 50, 450, 200).setGridColor(&Hc0c0c0, &Hc0c0c0)
' Add a title to the chart
c.addTitle("Computer Vision Test Scores")
' Set the labels on the x axis and the font to Arial Bold
c.xAxis().setLabels(labels).setFontStyle("Arial Bold")
' Set the font for the y axis labels to Arial Bold
c.yAxis().setLabelStyle("Arial Bold")
' Add a Box Whisker layer using light blue 0x9999ff as the fill color and blue (0xcc) as the
' line color. Set the line width to 2 pixels
c.addBoxLayer(Q4Data, Q3Data, &H00ff00, "Top 25%")
c.addBoxLayer(Q3Data, Q2Data, &H9999ff, "25% - 50%")
c.addBoxLayer(Q2Data, Q1Data, &Hffff00, "50% - 75%")
c.addBoxLayer(Q1Data, Q0Data, &Hff0000, "Bottom 25%")
' Add legend box at top center above the plot area using 10pt Arial Bold Font
Dim b As LegendBox = c.addLegend(50 + 225, 22, False, "Arial Bold", 10)
b.setAlignment(Chart.TopCenter)
b.setBackground(Chart.Transparent)
' Output the chart
WebChartViewer1.Image = c.makeWebImage(Chart.SVG)
' Include tool tip for the chart
WebChartViewer1.ImageMap = c.getHTMLImageMap("", "", _
"title='{xLabel} ({dataSetName}): {bottom} to {top} points'")
End Sub
</script>
<html>
<head>
<script type="text/javascript" src="cdjcv.js"></script>
</head>
<body>
<chart:WebChartViewer id="WebChartViewer1" runat="server" />
</body>
</html>
[ASP.NET MVC - Controller] NetMvcCharts\Controllers\FloatingboxController.cs
using System;
using System.Web.Mvc;
using ChartDirector;

namespace NetMvcCharts.Controllers
{
    public class FloatingboxController : Controller
    {
        //
        // Default Action
        //
        public ActionResult Index()
        {
            ViewBag.Title = "Floating Box Chart";
            createChart(ViewBag.Viewer = new RazorChartViewer(HttpContext, "chart1"));
            return View("~/Views/Shared/ChartView.cshtml");
        }

        //
        // Create chart
        //
        private void createChart(RazorChartViewer viewer)
        {
            // Sample data for the Box-Whisker chart. Represents the minimum, 1st quartile, medium, 3rd
            // quartile and maximum values of some quantities
            double[] Q0Data = {40, 45, 40, 30, 20, 50, 25, 44};
            double[] Q1Data = {55, 60, 50, 40, 38, 60, 51, 60};
            double[] Q2Data = {62, 70, 60, 50, 48, 70, 62, 70};
            double[] Q3Data = {70, 80, 65, 60, 53, 78, 69, 76};
            double[] Q4Data = {80, 90, 75, 70, 60, 85, 80, 84};

            // The labels for the chart
            string[] labels = {"Group A", "Group B", "Group C", "Group D", "Group E", "Group F",
                "Group G", "Group H"};

            // Create a XYChart object of size 550 x 250 pixels
            XYChart c = new XYChart(550, 275);

            // Set the plotarea at (50, 25) and of size 450 x 200 pixels. Enable both horizontal and
            // vertical grids by setting their colors to grey (0xc0c0c0)
            c.setPlotArea(50, 50, 450, 200).setGridColor(0xc0c0c0, 0xc0c0c0);

            // Add a title to the chart
            c.addTitle("Computer Vision Test Scores");

            // Set the labels on the x axis and the font to Arial Bold
            c.xAxis().setLabels(labels).setFontStyle("Arial Bold");

            // Set the font for the y axis labels to Arial Bold
            c.yAxis().setLabelStyle("Arial Bold");

            // Add a Box Whisker layer using light blue 0x9999ff as the fill color and blue (0xcc) as the
            // line color. Set the line width to 2 pixels
            c.addBoxLayer(Q4Data, Q3Data, 0x00ff00, "Top 25%");
            c.addBoxLayer(Q3Data, Q2Data, 0x9999ff, "25% - 50%");
            c.addBoxLayer(Q2Data, Q1Data, 0xffff00, "50% - 75%");
            c.addBoxLayer(Q1Data, Q0Data, 0xff0000, "Bottom 25%");

            // Add legend box at top center above the plot area using 10pt Arial Bold Font
            LegendBox b = c.addLegend(50 + 225, 22, false, "Arial Bold", 10);
            b.setAlignment(Chart.TopCenter);
            b.setBackground(Chart.Transparent);

            // Output the chart
            viewer.Image = c.makeWebImage(Chart.SVG);

            // Include tool tip for the chart
            viewer.ImageMap = c.getHTMLImageMap("", "",
                "title='{xLabel} ({dataSetName}): {bottom} to {top} points'");
        }
    }
}
[ASP.NET MVC - View] NetMvcCharts\Views\Shared\ChartView.cshtml
@{ Layout = null; }

<!DOCTYPE html>

<html>
<head>
    <meta name="viewport" content="width=device-width" />
    <title>@ViewBag.Title</title>
    <style>
        @ViewBag.Style
    </style>
    @Scripts.Render("~/Scripts/cdjcv.js")
</head>
<body style="margin:5px 0px 0px 5px">
    <div style="font:bold 18pt verdana;">
        @ViewBag.Title
    </div>
    <hr style="border:solid 1px #000080; background:#000080" />
    <div>
        @{
            if (ViewBag.Viewer is Array)
            {
                // Display multiple charts
                for (int i = 0; i < ViewBag.Viewer.Length; ++i)
                {
                    @:@Html.Raw(ViewBag.Viewer[i].RenderHTML())
                }
            }
            else
            {
                // Display one chart only
                @:@Html.Raw(ViewBag.Viewer.RenderHTML())
            }
        }
    </div>
</body>
</html>
© 2023 Advanced Software Engineering Limited. All rights reserved.