[Windows Forms - C# version] NetWinCharts\CSharpWinCharts\fourq.cs
using System;
using ChartDirector;
namespace CSharpChartExplorer
{
public class fourq : DemoModule
{
//Name of demo module
public string getName() { return "4 Quadrant Chart"; }
//Number of charts produced in this demo module
public int getNoOfCharts() { return 1; }
//Main code for creating chart.
//Note: the argument chartIndex is unused because this demo only has 1 chart.
public void createChart(WinChartViewer viewer, int chartIndex)
{
// XY points for the scatter chart
double[] dataX0 = {10, 15, 6, -12, 14, -8, 13, -13, 16, 12, 10.5};
double[] dataY0 = {130, 150, 80, 110, -110, -105, -130, 115, -170, 125, 125};
double[] dataX1 = {6, 7, -4, 3.5, 7, 8, -9, -10, -12, 11, 8};
double[] dataY1 = {65, -40, -40, 45, -70, -80, 80, 10, -100, 105, 60};
double[] dataX2 = {-10, -12, 11, 8, 6, 12, -4, 3.5, 7, 8, -9};
double[] dataY2 = {65, -80, -40, 45, -70, -80, 80, 90, -100, 105, 60};
// Create a XYChart object of size 600 x 300 pixels, with a light blue (ccccff)
// background, a black border, and 1 pixel 3D border effect
XYChart c = new XYChart(600, 480, 0xccccff, 0x000000, 1);
// Add a title box to the chart using 16pt Arial Bold Italic font, with white text on
// deep blue background
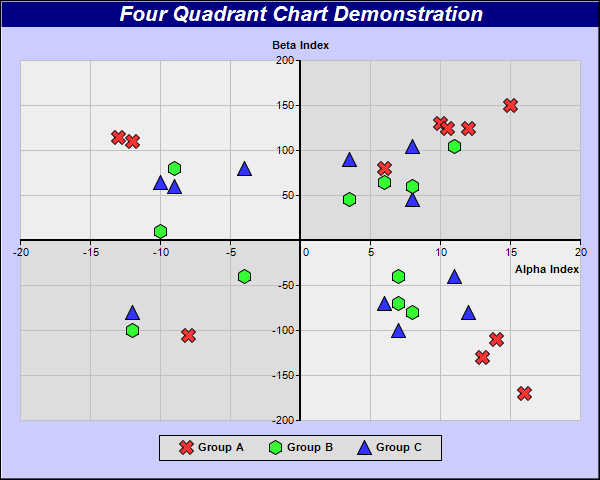
c.addTitle("Four Quadrant Chart Demonstration", "Arial Bold Italic", 16, 0xffffff
).setBackground(0x000080);
// Set the plotarea at (20, 60) and of size 560 x 360 pixels, with grey (808080) border,
// and light grey (c0c0c0) horizontal and vertical grid lines. Set 4 quadrant coloring,
// where the colors of the quadrants alternate between lighter and deeper grey
// (dddddd/eeeeee)
c.setPlotArea(20, 60, 560, 360, -1, -1, 0x808080, 0xc0c0c0, 0xc0c0c0).set4QBgColor(
0xdddddd, 0xeeeeee, 0xdddddd, 0xeeeeee);
// Set 4 quadrant mode, with both x and y axes symetrical around the origin
c.setAxisAtOrigin(Chart.XYAxisAtOrigin, Chart.XAxisSymmetric + Chart.YAxisSymmetric);
// Add a legend box at (300, 460) (bottom center of the chart) with horizontal layout.
// Use 8pt Arial Bold font.
LegendBox legendBox = c.addLegend(300, 460, false, "Arial Bold", 8);
legendBox.setAlignment(Chart.BottomCenter);
// Set legend box background to light grey (dddddd) with a black border
legendBox.setBackground(0xdddddd, 0);
// Set left/right margin to 20 pixels and top/bottom margin to 5 pixels
legendBox.setMargin2(20, 20, 5, 5);
// Add a titles to axes
c.xAxis().setTitle("Alpha Index");
c.yAxis().setTitle("Beta Index");
// Set axes width to 2 pixels
c.xAxis().setWidth(2);
c.yAxis().setWidth(2);
// Add scatter layer, using 15 pixels red (ff33333) X shape symbols
c.addScatterLayer(dataX0, dataY0, "Group A", Chart.Cross2Shape(), 15, 0xff3333);
// Add scatter layer, using 15 pixels green (33ff33) 6-sided polygon symbols
c.addScatterLayer(dataX1, dataY1, "Group B", Chart.PolygonShape(6), 15, 0x33ff33);
// Add scatter layer, using 15 pixels blue (3333ff) triangle symbols
c.addScatterLayer(dataX2, dataY2, "Group C", Chart.TriangleSymbol, 15, 0x3333ff);
// Output the chart
viewer.Chart = c;
//include tool tip for the chart
viewer.ImageMap = c.getHTMLImageMap("clickable", "",
"title='[{dataSetName}] Alpha = {x}, Beta = {value}'");
}
}
}
[Windows Forms - VB Version] NetWinCharts\VBNetWinCharts\fourq.vb
Imports System
Imports Microsoft.VisualBasic
Imports ChartDirector

Public Class fourq
    Implements DemoModule

    'Name of demo module
    Public Function getName() As String Implements DemoModule.getName
        Return "4 Quadrant Chart"
    End Function

    'Number of charts produced in this demo module
    Public Function getNoOfCharts() As Integer Implements DemoModule.getNoOfCharts
        Return 1
    End Function

    'Main code for creating chart.
    'Note: the argument chartIndex is unused because this demo only has 1 chart.
    Public Sub createChart(viewer As WinChartViewer, chartIndex As Integer) _
        Implements DemoModule.createChart

        ' XY points for the scatter chart
        Dim dataX0() As Double = {10, 15, 6, -12, 14, -8, 13, -13, 16, 12, 10.5}
        Dim dataY0() As Double = {130, 150, 80, 110, -110, -105, -130, 115, -170, 125, 125}

        Dim dataX1() As Double = {6, 7, -4, 3.5, 7, 8, -9, -10, -12, 11, 8}
        Dim dataY1() As Double = {65, -40, -40, 45, -70, -80, 80, 10, -100, 105, 60}

        Dim dataX2() As Double = {-10, -12, 11, 8, 6, 12, -4, 3.5, 7, 8, -9}
        Dim dataY2() As Double = {65, -80, -40, 45, -70, -80, 80, 90, -100, 105, 60}

        ' Create a XYChart object of size 600 x 300 pixels, with a light blue (ccccff) background, a
        ' black border, and 1 pixel 3D border effect
        Dim c As XYChart = New XYChart(600, 480, &Hccccff, &H000000, 1)

        ' Add a title box to the chart using 16pt Arial Bold Italic font, with white text on deep
        ' blue background
        c.addTitle("Four Quadrant Chart Demonstration", "Arial Bold Italic", 16, &Hffffff _
            ).setBackground(&H000080)

        ' Set the plotarea at (20, 60) and of size 560 x 360 pixels, with grey (808080) border, and
        ' light grey (c0c0c0) horizontal and vertical grid lines. Set 4 quadrant coloring, where the
        ' colors of the quadrants alternate between lighter and deeper grey (dddddd/eeeeee)
        c.setPlotArea(20, 60, 560, 360, -1, -1, &H808080, &Hc0c0c0, &Hc0c0c0).set4QBgColor( _
            &Hdddddd, &Heeeeee, &Hdddddd, &Heeeeee)

        ' Set 4 quadrant mode, with both x and y axes symetrical around the origin
        c.setAxisAtOrigin(Chart.XYAxisAtOrigin, Chart.XAxisSymmetric + Chart.YAxisSymmetric)

        ' Add a legend box at (300, 460) (bottom center of the chart) with horizontal layout. Use
        ' 8pt Arial Bold font.
        Dim legendBox As LegendBox = c.addLegend(300, 460, False, "Arial Bold", 8)
        legendBox.setAlignment(Chart.BottomCenter)

        ' Set legend box background to light grey (dddddd) with a black border
        legendBox.setBackground(&Hdddddd, 0)

        ' Set left/right margin to 20 pixels and top/bottom margin to 5 pixels
        legendBox.setMargin2(20, 20, 5, 5)

        ' Add a titles to axes
        c.xAxis().setTitle("Alpha Index")
        c.yAxis().setTitle("Beta Index")

        ' Set axes width to 2 pixels
        c.xAxis().setWidth(2)
        c.yAxis().setWidth(2)

        ' Add scatter layer, using 15 pixels red (ff33333) X shape symbols
        c.addScatterLayer(dataX0, dataY0, "Group A", Chart.Cross2Shape(), 15, &Hff3333)

        ' Add scatter layer, using 15 pixels green (33ff33) 6-sided polygon symbols
        c.addScatterLayer(dataX1, dataY1, "Group B", Chart.PolygonShape(6), 15, &H33ff33)

        ' Add scatter layer, using 15 pixels blue (3333ff) triangle symbols
        c.addScatterLayer(dataX2, dataY2, "Group C", Chart.TriangleSymbol, 15, &H3333ff)

        ' Output the chart
        viewer.Chart = c

        'include tool tip for the chart
        viewer.ImageMap = c.getHTMLImageMap("clickable", "", _
            "title='[{dataSetName}] Alpha = {x}, Beta = {value}'")

    End Sub

End Class
[WPF - C#] NetWPFCharts\CSharpWPFCharts\fourq.cs
using System;
using ChartDirector;

namespace CSharpWPFCharts
{
    public class fourq : DemoModule
    {
        //Name of demo module
        public string getName() { return "4 Quadrant Chart"; }

        //Number of charts produced in this demo module
        public int getNoOfCharts() { return 1; }

        //Main code for creating chart.
        //Note: the argument chartIndex is unused because this demo only has 1 chart.
        public void createChart(WPFChartViewer viewer, int chartIndex)
        {
            // XY points for the scatter chart
            double[] dataX0 = {10, 15, 6, -12, 14, -8, 13, -13, 16, 12, 10.5};
            double[] dataY0 = {130, 150, 80, 110, -110, -105, -130, 115, -170, 125, 125};

            double[] dataX1 = {6, 7, -4, 3.5, 7, 8, -9, -10, -12, 11, 8};
            double[] dataY1 = {65, -40, -40, 45, -70, -80, 80, 10, -100, 105, 60};

            double[] dataX2 = {-10, -12, 11, 8, 6, 12, -4, 3.5, 7, 8, -9};
            double[] dataY2 = {65, -80, -40, 45, -70, -80, 80, 90, -100, 105, 60};

            // Create a XYChart object of size 600 x 300 pixels, with a light blue (ccccff)
            // background, a black border, and 1 pixel 3D border effect
            XYChart c = new XYChart(600, 480, 0xccccff, 0x000000, 1);

            // Add a title box to the chart using 16pt Arial Bold Italic font, with white text on
            // deep blue background
            c.addTitle("Four Quadrant Chart Demonstration", "Arial Bold Italic", 16, 0xffffff
                ).setBackground(0x000080);

            // Set the plotarea at (20, 60) and of size 560 x 360 pixels, with grey (808080) border,
            // and light grey (c0c0c0) horizontal and vertical grid lines. Set 4 quadrant coloring,
            // where the colors of the quadrants alternate between lighter and deeper grey
            // (dddddd/eeeeee)
            c.setPlotArea(20, 60, 560, 360, -1, -1, 0x808080, 0xc0c0c0, 0xc0c0c0).set4QBgColor(
                0xdddddd, 0xeeeeee, 0xdddddd, 0xeeeeee);

            // Set 4 quadrant mode, with both x and y axes symetrical around the origin
            c.setAxisAtOrigin(Chart.XYAxisAtOrigin, Chart.XAxisSymmetric + Chart.YAxisSymmetric);

            // Add a legend box at (300, 460) (bottom center of the chart) with horizontal layout.
            // Use 8pt Arial Bold font.
            LegendBox legendBox = c.addLegend(300, 460, false, "Arial Bold", 8);
            legendBox.setAlignment(Chart.BottomCenter);

            // Set legend box background to light grey (dddddd) with a black border
            legendBox.setBackground(0xdddddd, 0);

            // Set left/right margin to 20 pixels and top/bottom margin to 5 pixels
            legendBox.setMargin2(20, 20, 5, 5);

            // Add a titles to axes
            c.xAxis().setTitle("Alpha Index");
            c.yAxis().setTitle("Beta Index");

            // Set axes width to 2 pixels
            c.xAxis().setWidth(2);
            c.yAxis().setWidth(2);

            // Add scatter layer, using 15 pixels red (ff33333) X shape symbols
            c.addScatterLayer(dataX0, dataY0, "Group A", Chart.Cross2Shape(), 15, 0xff3333);

            // Add scatter layer, using 15 pixels green (33ff33) 6-sided polygon symbols
            c.addScatterLayer(dataX1, dataY1, "Group B", Chart.PolygonShape(6), 15, 0x33ff33);

            // Add scatter layer, using 15 pixels blue (3333ff) triangle symbols
            c.addScatterLayer(dataX2, dataY2, "Group C", Chart.TriangleSymbol, 15, 0x3333ff);

            // Output the chart
            viewer.Chart = c;

            //include tool tip for the chart
            viewer.ImageMap = c.getHTMLImageMap("clickable", "",
                "title='[{dataSetName}] Alpha = {x}, Beta = {value}'");
        }
    }
}
[ASP.NET Web Forms - C# version] NetWebCharts\CSharpASP\fourq.aspx
(Click here on how to convert this code to code-behind style.)<%@ Page Language="C#" Debug="true" %>
<%@ Import Namespace="ChartDirector" %>
<%@ Register TagPrefix="chart" Namespace="ChartDirector" Assembly="netchartdir" %>
<!DOCTYPE html>
<script runat="server">
//
// Page Load event handler
//
protected void Page_Load(object sender, EventArgs e)
{
// XY points for the scatter chart
double[] dataX0 = {10, 15, 6, -12, 14, -8, 13, -13, 16, 12, 10.5};
double[] dataY0 = {130, 150, 80, 110, -110, -105, -130, 115, -170, 125, 125};
double[] dataX1 = {6, 7, -4, 3.5, 7, 8, -9, -10, -12, 11, 8};
double[] dataY1 = {65, -40, -40, 45, -70, -80, 80, 10, -100, 105, 60};
double[] dataX2 = {-10, -12, 11, 8, 6, 12, -4, 3.5, 7, 8, -9};
double[] dataY2 = {65, -80, -40, 45, -70, -80, 80, 90, -100, 105, 60};
// Create a XYChart object of size 600 x 300 pixels, with a light blue (ccccff) background, a
// black border, and 1 pixel 3D border effect
XYChart c = new XYChart(600, 480, 0xccccff, 0x000000, 1);
// Add a title box to the chart using 16pt Arial Bold Italic font, with white text on deep blue
// background
c.addTitle("Four Quadrant Chart Demonstration", "Arial Bold Italic", 16, 0xffffff
).setBackground(0x000080);
// Set the plotarea at (20, 60) and of size 560 x 360 pixels, with grey (808080) border, and
// light grey (c0c0c0) horizontal and vertical grid lines. Set 4 quadrant coloring, where the
// colors of the quadrants alternate between lighter and deeper grey (dddddd/eeeeee)
c.setPlotArea(20, 60, 560, 360, -1, -1, 0x808080, 0xc0c0c0, 0xc0c0c0).set4QBgColor(0xdddddd,
0xeeeeee, 0xdddddd, 0xeeeeee);
// Set 4 quadrant mode, with both x and y axes symetrical around the origin
c.setAxisAtOrigin(Chart.XYAxisAtOrigin, Chart.XAxisSymmetric + Chart.YAxisSymmetric);
// Add a legend box at (300, 460) (bottom center of the chart) with horizontal layout. Use 8pt
// Arial Bold font.
LegendBox legendBox = c.addLegend(300, 460, false, "Arial Bold", 8);
legendBox.setAlignment(Chart.BottomCenter);
// Set legend box background to light grey (dddddd) with a black border
legendBox.setBackground(0xdddddd, 0);
// Set left/right margin to 20 pixels and top/bottom margin to 5 pixels
legendBox.setMargin2(20, 20, 5, 5);
// Add a titles to axes
c.xAxis().setTitle("Alpha Index");
c.yAxis().setTitle("Beta Index");
// Set axes width to 2 pixels
c.xAxis().setWidth(2);
c.yAxis().setWidth(2);
// Add scatter layer, using 15 pixels red (ff33333) X shape symbols
c.addScatterLayer(dataX0, dataY0, "Group A", Chart.Cross2Shape(), 15, 0xff3333);
// Add scatter layer, using 15 pixels green (33ff33) 6-sided polygon symbols
c.addScatterLayer(dataX1, dataY1, "Group B", Chart.PolygonShape(6), 15, 0x33ff33);
// Add scatter layer, using 15 pixels blue (3333ff) triangle symbols
c.addScatterLayer(dataX2, dataY2, "Group C", Chart.TriangleSymbol, 15, 0x3333ff);
// Output the chart
WebChartViewer1.Image = c.makeWebImage(Chart.SVG);
// Include tool tip for the chart
WebChartViewer1.ImageMap = c.getHTMLImageMap("", "",
"title='[{dataSetName}] Alpha = {x}, Beta = {value}'");
}
</script>
<html>
<head>
<script type="text/javascript" src="cdjcv.js"></script>
</head>
<body>
<chart:WebChartViewer id="WebChartViewer1" runat="server" />
</body>
</html>
[ASP.NET Web Forms - VB Version] NetWebCharts\VBNetASP\fourq.aspx
(Click here on how to convert this code to code-behind style.)<%@ Page Language="VB" Debug="true" %>
<%@ Import Namespace="ChartDirector" %>
<%@ Register TagPrefix="chart" Namespace="ChartDirector" Assembly="netchartdir" %>
<!DOCTYPE html>
<script runat="server">
'
' Page Load event handler
'
Protected Sub Page_Load(ByVal sender As System.Object, ByVal e As System.EventArgs)
' XY points for the scatter chart
Dim dataX0() As Double = {10, 15, 6, -12, 14, -8, 13, -13, 16, 12, 10.5}
Dim dataY0() As Double = {130, 150, 80, 110, -110, -105, -130, 115, -170, 125, 125}
Dim dataX1() As Double = {6, 7, -4, 3.5, 7, 8, -9, -10, -12, 11, 8}
Dim dataY1() As Double = {65, -40, -40, 45, -70, -80, 80, 10, -100, 105, 60}
Dim dataX2() As Double = {-10, -12, 11, 8, 6, 12, -4, 3.5, 7, 8, -9}
Dim dataY2() As Double = {65, -80, -40, 45, -70, -80, 80, 90, -100, 105, 60}
' Create a XYChart object of size 600 x 300 pixels, with a light blue (ccccff) background, a
' black border, and 1 pixel 3D border effect
Dim c As XYChart = New XYChart(600, 480, &Hccccff, &H000000, 1)
' Add a title box to the chart using 16pt Arial Bold Italic font, with white text on deep blue
' background
c.addTitle("Four Quadrant Chart Demonstration", "Arial Bold Italic", 16, &Hffffff _
).setBackground(&H000080)
' Set the plotarea at (20, 60) and of size 560 x 360 pixels, with grey (808080) border, and
' light grey (c0c0c0) horizontal and vertical grid lines. Set 4 quadrant coloring, where the
' colors of the quadrants alternate between lighter and deeper grey (dddddd/eeeeee)
c.setPlotArea(20, 60, 560, 360, -1, -1, &H808080, &Hc0c0c0, &Hc0c0c0).set4QBgColor(&Hdddddd, _
&Heeeeee, &Hdddddd, &Heeeeee)
' Set 4 quadrant mode, with both x and y axes symetrical around the origin
c.setAxisAtOrigin(Chart.XYAxisAtOrigin, Chart.XAxisSymmetric + Chart.YAxisSymmetric)
' Add a legend box at (300, 460) (bottom center of the chart) with horizontal layout. Use 8pt
' Arial Bold font.
Dim legendBox As LegendBox = c.addLegend(300, 460, False, "Arial Bold", 8)
legendBox.setAlignment(Chart.BottomCenter)
' Set legend box background to light grey (dddddd) with a black border
legendBox.setBackground(&Hdddddd, 0)
' Set left/right margin to 20 pixels and top/bottom margin to 5 pixels
legendBox.setMargin2(20, 20, 5, 5)
' Add a titles to axes
c.xAxis().setTitle("Alpha Index")
c.yAxis().setTitle("Beta Index")
' Set axes width to 2 pixels
c.xAxis().setWidth(2)
c.yAxis().setWidth(2)
' Add scatter layer, using 15 pixels red (ff33333) X shape symbols
c.addScatterLayer(dataX0, dataY0, "Group A", Chart.Cross2Shape(), 15, &Hff3333)
' Add scatter layer, using 15 pixels green (33ff33) 6-sided polygon symbols
c.addScatterLayer(dataX1, dataY1, "Group B", Chart.PolygonShape(6), 15, &H33ff33)
' Add scatter layer, using 15 pixels blue (3333ff) triangle symbols
c.addScatterLayer(dataX2, dataY2, "Group C", Chart.TriangleSymbol, 15, &H3333ff)
' Output the chart
WebChartViewer1.Image = c.makeWebImage(Chart.SVG)
' Include tool tip for the chart
WebChartViewer1.ImageMap = c.getHTMLImageMap("", "", _
"title='[{dataSetName}] Alpha = {x}, Beta = {value}'")
End Sub
</script>
<html>
<head>
<script type="text/javascript" src="cdjcv.js"></script>
</head>
<body>
<chart:WebChartViewer id="WebChartViewer1" runat="server" />
</body>
</html>
[ASP.NET MVC - Controller] NetMvcCharts\Controllers\FourqController.cs
using System;
using System.Web.Mvc;
using ChartDirector;

namespace NetMvcCharts.Controllers
{
    public class FourqController : Controller
    {
        //
        // Default Action
        //
        public ActionResult Index()
        {
            ViewBag.Title = "4 Quadrant Chart";
            createChart(ViewBag.Viewer = new RazorChartViewer(HttpContext, "chart1"));
            return View("~/Views/Shared/ChartView.cshtml");
        }

        //
        // Create chart
        //
        private void createChart(RazorChartViewer viewer)
        {
            // XY points for the scatter chart
            double[] dataX0 = {10, 15, 6, -12, 14, -8, 13, -13, 16, 12, 10.5};
            double[] dataY0 = {130, 150, 80, 110, -110, -105, -130, 115, -170, 125, 125};

            double[] dataX1 = {6, 7, -4, 3.5, 7, 8, -9, -10, -12, 11, 8};
            double[] dataY1 = {65, -40, -40, 45, -70, -80, 80, 10, -100, 105, 60};

            double[] dataX2 = {-10, -12, 11, 8, 6, 12, -4, 3.5, 7, 8, -9};
            double[] dataY2 = {65, -80, -40, 45, -70, -80, 80, 90, -100, 105, 60};

            // Create a XYChart object of size 600 x 300 pixels, with a light blue (ccccff) background, a
            // black border, and 1 pixel 3D border effect
            XYChart c = new XYChart(600, 480, 0xccccff, 0x000000, 1);

            // Add a title box to the chart using 16pt Arial Bold Italic font, with white text on deep
            // blue background
            c.addTitle("Four Quadrant Chart Demonstration", "Arial Bold Italic", 16, 0xffffff
                ).setBackground(0x000080);

            // Set the plotarea at (20, 60) and of size 560 x 360 pixels, with grey (808080) border, and
            // light grey (c0c0c0) horizontal and vertical grid lines. Set 4 quadrant coloring, where the
            // colors of the quadrants alternate between lighter and deeper grey (dddddd/eeeeee)
            c.setPlotArea(20, 60, 560, 360, -1, -1, 0x808080, 0xc0c0c0, 0xc0c0c0).set4QBgColor(0xdddddd,
                0xeeeeee, 0xdddddd, 0xeeeeee);

            // Set 4 quadrant mode, with both x and y axes symetrical around the origin
            c.setAxisAtOrigin(Chart.XYAxisAtOrigin, Chart.XAxisSymmetric + Chart.YAxisSymmetric);

            // Add a legend box at (300, 460) (bottom center of the chart) with horizontal layout. Use
            // 8pt Arial Bold font.
            LegendBox legendBox = c.addLegend(300, 460, false, "Arial Bold", 8);
            legendBox.setAlignment(Chart.BottomCenter);

            // Set legend box background to light grey (dddddd) with a black border
            legendBox.setBackground(0xdddddd, 0);

            // Set left/right margin to 20 pixels and top/bottom margin to 5 pixels
            legendBox.setMargin2(20, 20, 5, 5);

            // Add a titles to axes
            c.xAxis().setTitle("Alpha Index");
            c.yAxis().setTitle("Beta Index");

            // Set axes width to 2 pixels
            c.xAxis().setWidth(2);
            c.yAxis().setWidth(2);

            // Add scatter layer, using 15 pixels red (ff33333) X shape symbols
            c.addScatterLayer(dataX0, dataY0, "Group A", Chart.Cross2Shape(), 15, 0xff3333);

            // Add scatter layer, using 15 pixels green (33ff33) 6-sided polygon symbols
            c.addScatterLayer(dataX1, dataY1, "Group B", Chart.PolygonShape(6), 15, 0x33ff33);

            // Add scatter layer, using 15 pixels blue (3333ff) triangle symbols
            c.addScatterLayer(dataX2, dataY2, "Group C", Chart.TriangleSymbol, 15, 0x3333ff);

            // Output the chart
            viewer.Image = c.makeWebImage(Chart.SVG);

            // Include tool tip for the chart
            viewer.ImageMap = c.getHTMLImageMap("", "",
                "title='[{dataSetName}] Alpha = {x}, Beta = {value}'");
        }
    }
}
[ASP.NET MVC - View] NetMvcCharts\Views\Shared\ChartView.cshtml
@{ Layout = null; }

<!DOCTYPE html>

<html>
<head>
    <meta name="viewport" content="width=device-width" />
    <title>@ViewBag.Title</title>
    <style>
        @ViewBag.Style
    </style>
    @Scripts.Render("~/Scripts/cdjcv.js")
</head>
<body style="margin:5px 0px 0px 5px">
    <div style="font:bold 18pt verdana;">
        @ViewBag.Title
    </div>
    <hr style="border:solid 1px #000080; background:#000080" />
    <div>
        @{
            if (ViewBag.Viewer is Array)
            {
                // Display multiple charts
                for (int i = 0; i < ViewBag.Viewer.Length; ++i)
                {
                    @:@Html.Raw(ViewBag.Viewer[i].RenderHTML())
                }
            }
            else
            {
                // Display one chart only
                @:@Html.Raw(ViewBag.Viewer.RenderHTML())
            }
        }
    </div>
</body>
</html>
© 2023 Advanced Software Engineering Limited. All rights reserved.