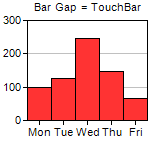
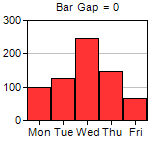
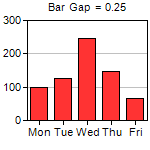

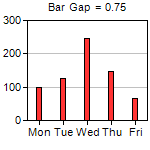
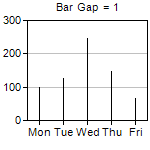
This example demonstrates the effects of different bar gaps configured using BarLayer.setBarGap.
ChartDirector 7.1 (.NET Edition)
Bar Gap
Source Code Listing
using System;
using ChartDirector;

namespace CSharpChartExplorer
{
    public class gapbar : DemoModule
    {
        //Name of demo module
        public string getName() { return "Bar Gap"; }

        //Number of charts produced in this demo module
        public int getNoOfCharts() { return 6; }

        //Main code for creating charts
        public void createChart(WinChartViewer viewer, int chartIndex)
        {
            double bargap = chartIndex * 0.25 - 0.25;

            // The data for the bar chart
            double[] data = {100, 125, 245, 147, 67};

            // The labels for the bar chart
            string[] labels = {"Mon", "Tue", "Wed", "Thu", "Fri"};

            // Create a XYChart object of size 150 x 150 pixels
            XYChart c = new XYChart(150, 150);

            // Set the plotarea at (27, 20) and of size 120 x 100 pixels
            c.setPlotArea(27, 20, 120, 100);

            // Set the labels on the x axis
            c.xAxis().setLabels(labels);

            if (bargap >= 0) {
                // Add a title to display to bar gap using 8pt Arial font
                c.addTitle("      Bar Gap = " + bargap, "Arial", 8);
            } else {
                // Use negative value to mean TouchBar
                c.addTitle("      Bar Gap = TouchBar", "Arial", 8);
                bargap = Chart.TouchBar;
            }

            // Add a bar chart layer using the given data and set the bar gap
            c.addBarLayer(data).setBarGap(bargap);

            // Output the chart
            viewer.Chart = c;

            //include tool tip for the chart
            viewer.ImageMap = c.getHTMLImageMap("clickable", "",
                "title='Production on {xLabel}: {value} kg'");
        }
    }
}Imports System
Imports Microsoft.VisualBasic
Imports ChartDirector
Public Class gapbar
Implements DemoModule
'Name of demo module
Public Function getName() As String Implements DemoModule.getName
Return "Bar Gap"
End Function
'Number of charts produced in this demo module
Public Function getNoOfCharts() As Integer Implements DemoModule.getNoOfCharts
Return 6
End Function
'Main code for creating charts
Public Sub createChart(viewer As WinChartViewer, chartIndex As Integer) _
Implements DemoModule.createChart
Dim bargap As Double = chartIndex * 0.25 - 0.25
' The data for the bar chart
Dim data() As Double = {100, 125, 245, 147, 67}
' The labels for the bar chart
Dim labels() As String = {"Mon", "Tue", "Wed", "Thu", "Fri"}
' Create a XYChart object of size 150 x 150 pixels
Dim c As XYChart = New XYChart(150, 150)
' Set the plotarea at (27, 20) and of size 120 x 100 pixels
c.setPlotArea(27, 20, 120, 100)
' Set the labels on the x axis
c.xAxis().setLabels(labels)
If bargap >= 0 Then
' Add a title to display to bar gap using 8pt Arial font
c.addTitle(" Bar Gap = " & bargap, "Arial", 8)
Else
' Use negative value to mean TouchBar
c.addTitle(" Bar Gap = TouchBar", "Arial", 8)
bargap = Chart.TouchBar
End If
' Add a bar chart layer using the given data and set the bar gap
c.addBarLayer(data).setBarGap(bargap)
' Output the chart
viewer.Chart = c
'include tool tip for the chart
viewer.ImageMap = c.getHTMLImageMap("clickable", "", _
"title='Production on {xLabel}: {value} kg'")
End Sub
End Classusing System;
using ChartDirector;
namespace CSharpWPFCharts
{
public class gapbar : DemoModule
{
//Name of demo module
public string getName() { return "Bar Gap"; }
//Number of charts produced in this demo module
public int getNoOfCharts() { return 6; }
//Main code for creating charts
public void createChart(WPFChartViewer viewer, int chartIndex)
{
double bargap = chartIndex * 0.25 - 0.25;
// The data for the bar chart
double[] data = {100, 125, 245, 147, 67};
// The labels for the bar chart
string[] labels = {"Mon", "Tue", "Wed", "Thu", "Fri"};
// Create a XYChart object of size 150 x 150 pixels
XYChart c = new XYChart(150, 150);
// Set the plotarea at (27, 20) and of size 120 x 100 pixels
c.setPlotArea(27, 20, 120, 100);
// Set the labels on the x axis
c.xAxis().setLabels(labels);
if (bargap >= 0) {
// Add a title to display to bar gap using 8pt Arial font
c.addTitle(" Bar Gap = " + bargap, "Arial", 8);
} else {
// Use negative value to mean TouchBar
c.addTitle(" Bar Gap = TouchBar", "Arial", 8);
bargap = Chart.TouchBar;
}
// Add a bar chart layer using the given data and set the bar gap
c.addBarLayer(data).setBarGap(bargap);
// Output the chart
viewer.Chart = c;
//include tool tip for the chart
viewer.ImageMap = c.getHTMLImageMap("clickable", "",
"title='Production on {xLabel}: {value} kg'");
}
}
}<%@ Page Language="C#" Debug="true" %>
<%@ Import Namespace="ChartDirector" %>
<%@ Register TagPrefix="chart" Namespace="ChartDirector" Assembly="netchartdir" %>
<!DOCTYPE html>
<script runat="server">
//
// Create chart
//
protected void createChart(WebChartViewer viewer, int chartIndex)
{
double bargap = chartIndex * 0.25 - 0.25;
// The data for the bar chart
double[] data = {100, 125, 245, 147, 67};
// The labels for the bar chart
string[] labels = {"Mon", "Tue", "Wed", "Thu", "Fri"};
// Create a XYChart object of size 150 x 150 pixels
XYChart c = new XYChart(150, 150);
// Set the plotarea at (27, 20) and of size 120 x 100 pixels
c.setPlotArea(27, 20, 120, 100);
// Set the labels on the x axis
c.xAxis().setLabels(labels);
if (bargap >= 0) {
// Add a title to display to bar gap using 8pt Arial font
c.addTitle(" Bar Gap = " + bargap, "Arial", 8);
} else {
// Use negative value to mean TouchBar
c.addTitle(" Bar Gap = TouchBar", "Arial", 8);
bargap = Chart.TouchBar;
}
// Add a bar chart layer using the given data and set the bar gap
c.addBarLayer(data).setBarGap(bargap);
// Output the chart
viewer.Image = c.makeWebImage(Chart.SVG);
// Include tool tip for the chart
viewer.ImageMap = c.getHTMLImageMap("", "", "title='Production on {xLabel}: {value} kg'");
}
//
// Page Load event handler
//
protected void Page_Load(object sender, EventArgs e)
{
createChart(WebChartViewer0, 0);
createChart(WebChartViewer1, 1);
createChart(WebChartViewer2, 2);
createChart(WebChartViewer3, 3);
createChart(WebChartViewer4, 4);
createChart(WebChartViewer5, 5);
}
</script>
<html>
<head>
<script type="text/javascript" src="cdjcv.js"></script>
</head>
<body>
<chart:WebChartViewer id="WebChartViewer0" runat="server" />
<chart:WebChartViewer id="WebChartViewer1" runat="server" />
<chart:WebChartViewer id="WebChartViewer2" runat="server" />
<chart:WebChartViewer id="WebChartViewer3" runat="server" />
<chart:WebChartViewer id="WebChartViewer4" runat="server" />
<chart:WebChartViewer id="WebChartViewer5" runat="server" />
</body>
</html><%@ Page Language="VB" Debug="true" %>
<%@ Import Namespace="ChartDirector" %>
<%@ Register TagPrefix="chart" Namespace="ChartDirector" Assembly="netchartdir" %>
<!DOCTYPE html>
<script runat="server">
'
' Create chart
'
Protected Sub createChart(viewer As WebChartViewer, chartIndex As Integer)
Dim bargap As Double = chartIndex * 0.25 - 0.25
' The data for the bar chart
Dim data() As Double = {100, 125, 245, 147, 67}
' The labels for the bar chart
Dim labels() As String = {"Mon", "Tue", "Wed", "Thu", "Fri"}
' Create a XYChart object of size 150 x 150 pixels
Dim c As XYChart = New XYChart(150, 150)
' Set the plotarea at (27, 20) and of size 120 x 100 pixels
c.setPlotArea(27, 20, 120, 100)
' Set the labels on the x axis
c.xAxis().setLabels(labels)
If bargap >= 0 Then
' Add a title to display to bar gap using 8pt Arial font
c.addTitle(" Bar Gap = " & bargap, "Arial", 8)
Else
' Use negative value to mean TouchBar
c.addTitle(" Bar Gap = TouchBar", "Arial", 8)
bargap = Chart.TouchBar
End If
' Add a bar chart layer using the given data and set the bar gap
c.addBarLayer(data).setBarGap(bargap)
' Output the chart
viewer.Image = c.makeWebImage(Chart.SVG)
' Include tool tip for the chart
viewer.ImageMap = c.getHTMLImageMap("", "", "title='Production on {xLabel}: {value} kg'")
End Sub
'
' Page Load event handler
'
Protected Sub Page_Load(ByVal sender As System.Object, ByVal e As System.EventArgs)
createChart(WebChartViewer0, 0)
createChart(WebChartViewer1, 1)
createChart(WebChartViewer2, 2)
createChart(WebChartViewer3, 3)
createChart(WebChartViewer4, 4)
createChart(WebChartViewer5, 5)
End Sub
</script>
<html>
<head>
<script type="text/javascript" src="cdjcv.js"></script>
</head>
<body>
<chart:WebChartViewer id="WebChartViewer0" runat="server" />
<chart:WebChartViewer id="WebChartViewer1" runat="server" />
<chart:WebChartViewer id="WebChartViewer2" runat="server" />
<chart:WebChartViewer id="WebChartViewer3" runat="server" />
<chart:WebChartViewer id="WebChartViewer4" runat="server" />
<chart:WebChartViewer id="WebChartViewer5" runat="server" />
</body>
</html>using System;
using System.Web.Mvc;
using ChartDirector;
namespace NetMvcCharts.Controllers
{
public class GapbarController : Controller
{
//
// Default Action
//
public ActionResult Index()
{
ViewBag.Title = "Bar Gap";
// This example contains 6 charts.
ViewBag.Viewer = new RazorChartViewer[6];
for (int i = 0; i < ViewBag.Viewer.Length; ++i)
createChart(ViewBag.Viewer[i] = new RazorChartViewer(HttpContext, "chart" + i), i);
return View("~/Views/Shared/ChartView.cshtml");
}
//
// Create chart
//
private void createChart(RazorChartViewer viewer, int chartIndex)
{
double bargap = chartIndex * 0.25 - 0.25;
// The data for the bar chart
double[] data = {100, 125, 245, 147, 67};
// The labels for the bar chart
string[] labels = {"Mon", "Tue", "Wed", "Thu", "Fri"};
// Create a XYChart object of size 150 x 150 pixels
XYChart c = new XYChart(150, 150);
// Set the plotarea at (27, 20) and of size 120 x 100 pixels
c.setPlotArea(27, 20, 120, 100);
// Set the labels on the x axis
c.xAxis().setLabels(labels);
if (bargap >= 0) {
// Add a title to display to bar gap using 8pt Arial font
c.addTitle(" Bar Gap = " + bargap, "Arial", 8);
} else {
// Use negative value to mean TouchBar
c.addTitle(" Bar Gap = TouchBar", "Arial", 8);
bargap = Chart.TouchBar;
}
// Add a bar chart layer using the given data and set the bar gap
c.addBarLayer(data).setBarGap(bargap);
// Output the chart
viewer.Image = c.makeWebImage(Chart.SVG);
// Include tool tip for the chart
viewer.ImageMap = c.getHTMLImageMap("", "", "title='Production on {xLabel}: {value} kg'");
}
}
}@{ Layout = null; }
<!DOCTYPE html>
<html>
<head>
<meta name="viewport" content="width=device-width" />
<title>@ViewBag.Title</title>
<style>
@ViewBag.Style
</style>
@Scripts.Render("~/Scripts/cdjcv.js")
</head>
<body style="margin:5px 0px 0px 5px">
<div style="font:bold 18pt verdana;">
@ViewBag.Title
</div>
<hr style="border:solid 1px #000080; background:#000080" />
<div>
@{
if (ViewBag.Viewer is Array)
{
// Display multiple charts
for (int i = 0; i < ViewBag.Viewer.Length; ++i)
{
@:@Html.Raw(ViewBag.Viewer[i].RenderHTML())
}
}
else
{
// Display one chart only
@:@Html.Raw(ViewBag.Viewer.RenderHTML())
}
}
</div>
</body>
</html>